
Analysis
Middle East War Amplifies Global Financial Market Risks

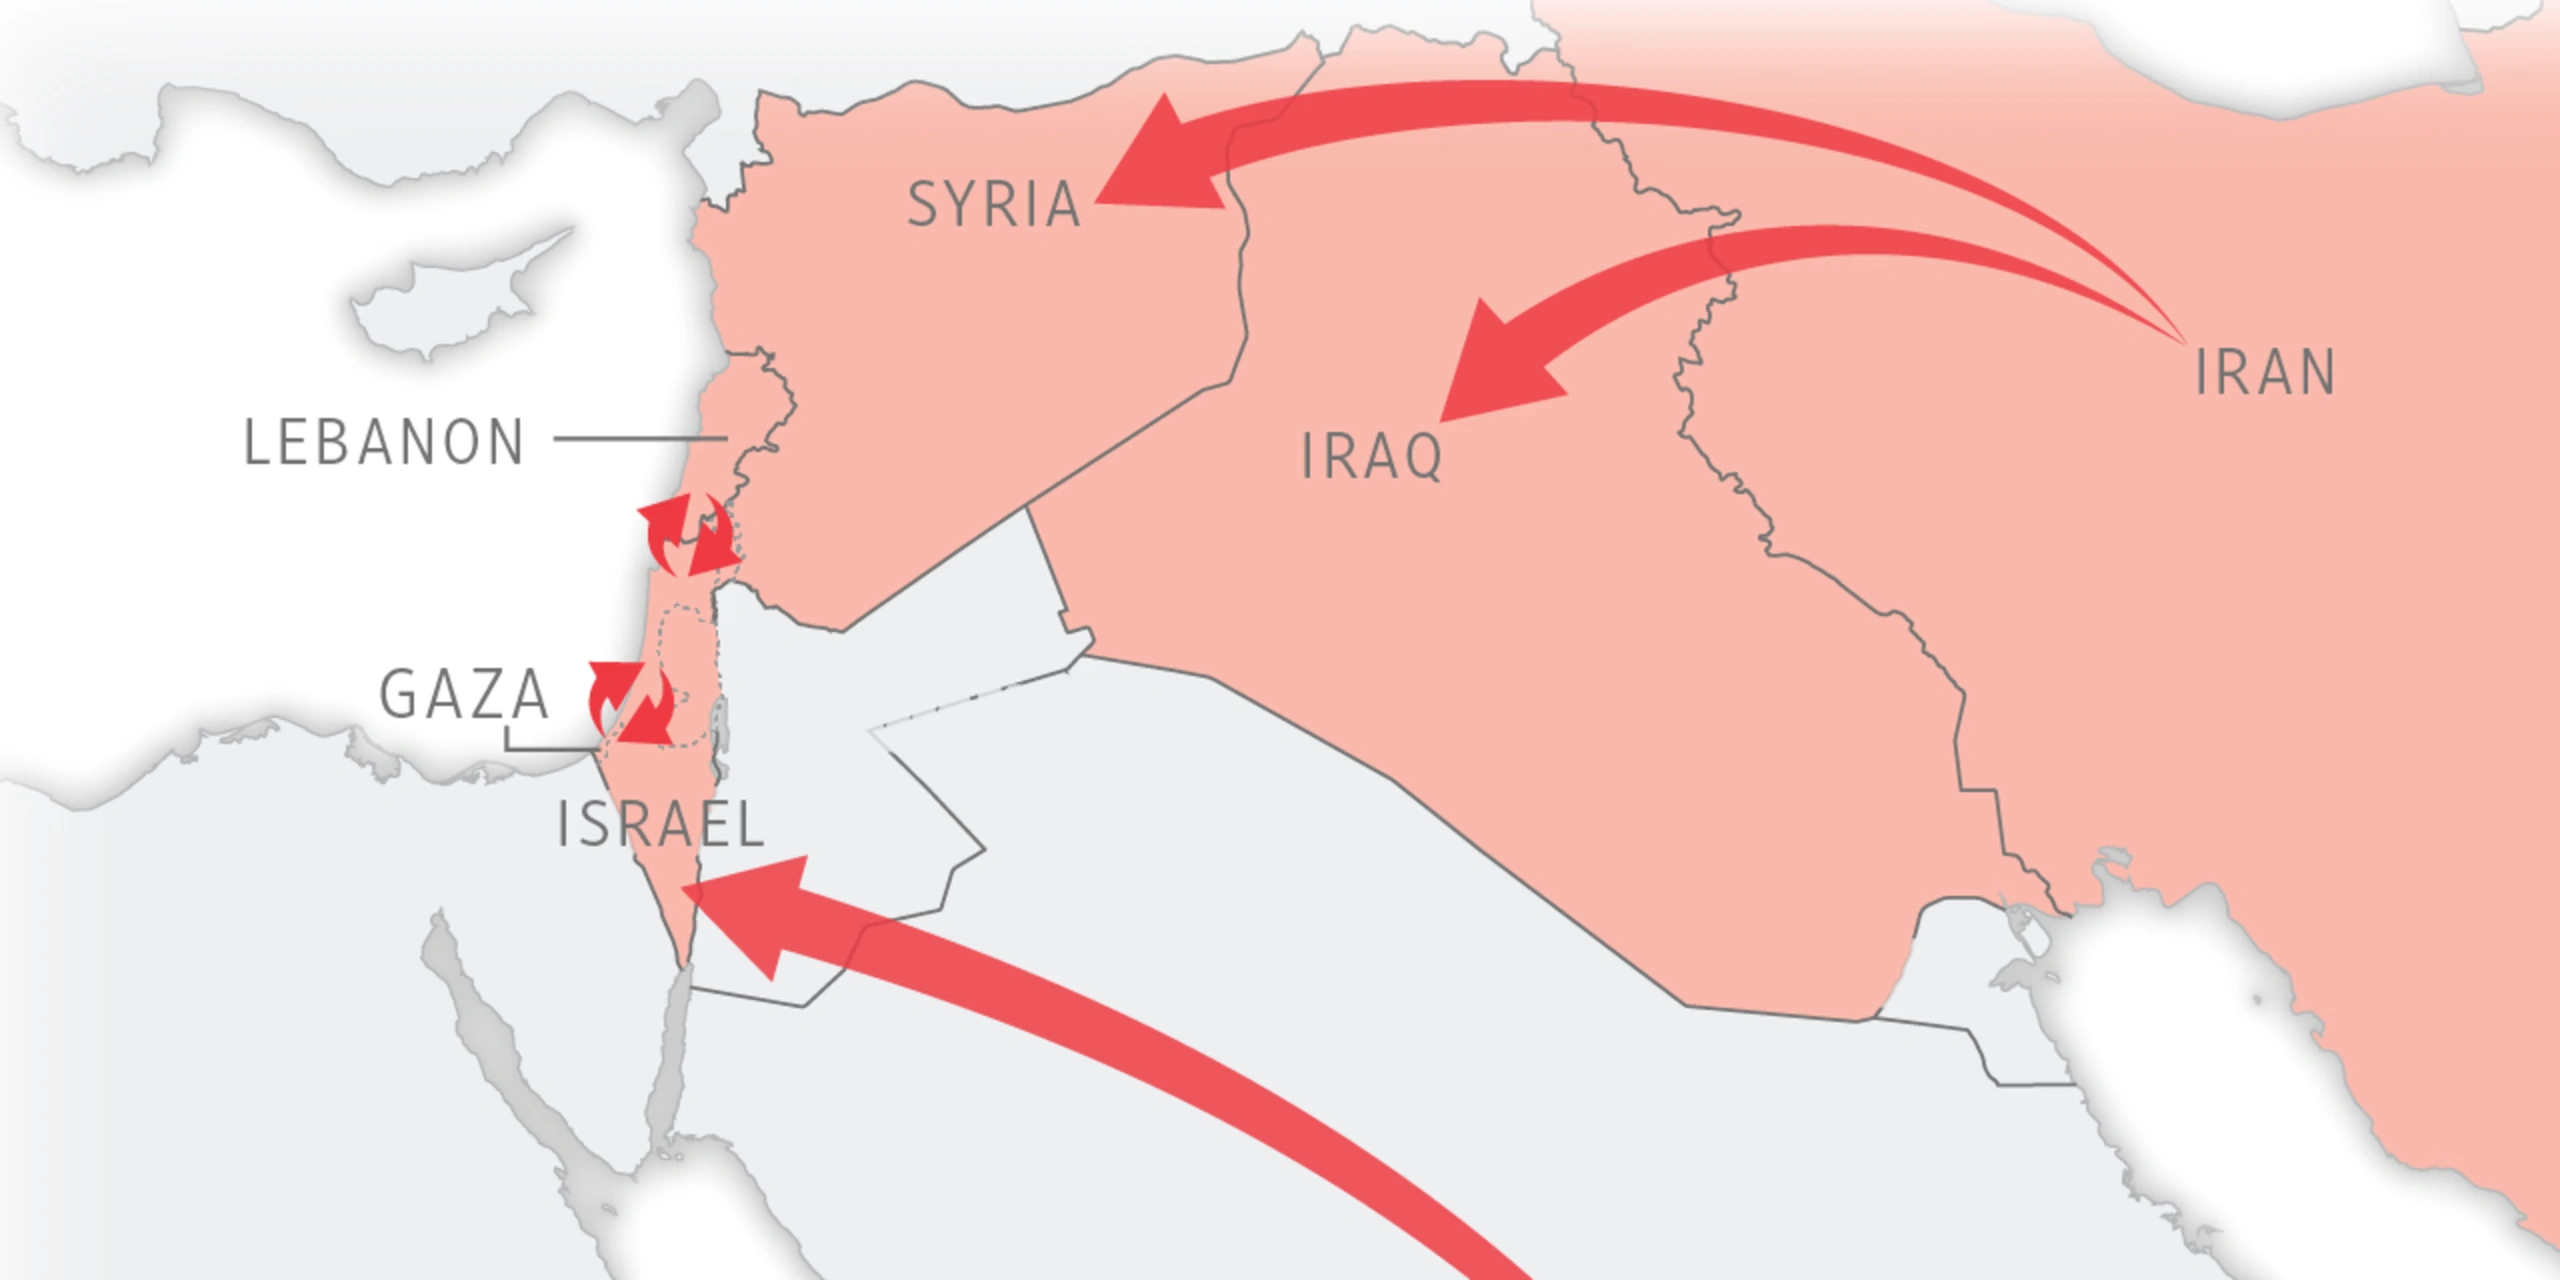
LONDON — At 4:32 a.m. on Monday, June 8, the Brent crude futures curve went vertical. In the space of seven minutes, a barrel of the global benchmark repriced from $105.20 to $114.30 — an 8.7% leap that veteran crude traders at Vitol and Glencore hadn’t witnessed since the opening hours of Russia’s full-scale invasion of Ukraine in February 2022. On the same screens, the VIX index — Wall Street’s fear gauge — spiked above 38, while the Japanese yen and the Swiss franc punched through three-month highs against the dollar. Gold broke $2,560 an ounce. The trigger was not an algorithm gone haywire nor a fat-finger error. It was a verified signal from the Strait of Hormuz.
Iran’s Revolutionary Guard Corps had mined the narrow waterway through which one-fifth of the world’s oil consumption transits, effectively sealing off 17 million barrels per day of crude and condensate flows. The act followed a 72-hour exchange of ballistic missile salvos between Israel and Iranian military installations near Isfahan, and the subsequent sinking of an Iran-bound container vessel by an Israeli submarine. By the time European exchanges opened, the Middle East’s slow-burn conflict had mutated into a full-throated conflagration with immediate, terrifying implications for every asset class on the planet.
What’s unfolding now isn’t simply a regional tragedy. It is a financial amplification event — the kind the Bank for International Settlements has warned about for a decade, in which a geopolitical shock interacts with layers of leverage, derivative concentration, and algorithmic positioning to produce sell-offs that race far ahead of any sober reassessment of fundamentals. The phrase amplification risk has moved from the footnotes of central bank financial stability reports to the central diagnosis of the moment.
The anatomy of an amplification shock
Global financial markets rarely price wars linearly. Instead, they process them through a chain of nonlinear amplifiers. The first amplifier is always energy. The Strait of Hormuz closure instantly removes roughly 18% of global oil supply, a magnitude that dwarfs the 1973 Arab oil embargo. The International Monetary Fund’s June 5 update to its World Economic Outlook — published three days before the maritime mining — had already flagged that a sustained $30-per-barrel oil price shock would subtract 1.2 percentage points from global GDP growth within four quarters. [The report](https://www.imf.org/en/Publications/WEO) now reads like an optimistic scenario. Brent’s settlement on June 8 was $118.60, and options markets were pricing a 25% probability of $150 crude by the August contract expiry, according to data from ICE Futures Europe compiled by Bloomberg.
The second amplifier is the dollar. Every major oil spike since 1990 has initially strengthened the US currency as importers scramble for dollars to pay inflated energy bills and investors seek the safety of US Treasuries. That pattern repeated on June 8 and 9: the DXY index surged 1.9%, crushing emerging-market currencies from the Indian rupee to the South African rand. A stronger dollar, in turn, tightens global financial conditions independently of what central banks do. The BIS Quarterly Review had, as recently as March 2026, mapped the vulnerability of non-bank financial intermediaries that have borrowed heavily in dollars via cross-currency swaps. When the dollar leaps, those positions require fresh collateral — forcing asset sales that feed the very volatility that triggered the margin call. It’s a doom loop the BIS labelled “the most underappreciated transmission channel of geopolitical shocks”.
The third amplifier is algorithmic crowding. Over the past three years, trend-following commodity trading advisers (CTAs) and volatility-targeting strategies have swollen to manage an estimated $900 billion in assets, according to research from J.P. Morgan’s prime brokerage unit. These strategies are pathologically programmed to sell equities and buy volatility when realised price swings breach certain thresholds. On June 8, they did exactly that — indiscriminately. The S&P 500 fell 4.7% by midday in New York, a move that machines magnified while human portfolio managers were still trying to ascertain whether the US Navy’s Fifth Fleet was moving toward the Strait.
Samir Khalaf, a 44-year-old crude oil trader who has worked at Vitol in Geneva since 2007, described the session as “five standard deviations from anything I’ve seen — and I’ve seen Iraq, Libya, and the financial crisis.” Khalaf’s desk handled 11 cargo inquiries in the first hour, three times the norm for a Monday. By 9 a.m. Central European Time, he told colleagues the physical market was “pricing in a six-week closure minimum.” Six weeks is the length of time it would take Saudi Arabia, the UAE, and Iraq to fully redirect crude flows through alternative pipelines — if those pipelines aren’t also targeted.
How the Middle East war rewires the global financial architecture
Beyond the immediate panic lies a more unsettling structural question. What does a prolonged interruption of Hormuz traffic do to the scaffolding of the international financial system? The answer is bleaker than many assume, because the system was not designed to decouple from the Middle East’s energy heartland quickly.
Secondary keyword: geopolitical risk amplification. That term captures how an initial shock — a missile, a mine, a sunken vessel — propagates through portfolios, forcing deleveraging and liquidity hoarding that hurt assets with no direct connection to the conflict. On June 9, that dynamic was visible in the investment-grade corporate bond market, where spreads widened by 32 basis points, the sharpest one-day move since the March 2020 dash for cash. ETF flows revealed heavy redemptions not only from emerging-market debt funds but also from high-yield European credit, a market with virtually zero direct exposure to the Middle East. The World Bank’s latest Global Economic Prospects report had warned in early June that financial contagion from a major geopolitical event could increase the cost of capital for developing economies by as much as 180 basis points within a month. That estimate now looks conservative.
One feature of this contagion deserves close attention: the mispricing of sovereign risk in the Gulf Cooperation Council (GCC) states. For years, investors have treated Qatar, the UAE, and Saudi Arabia as “geopolitical hedges” — oil-rich, dollar-pegged safe havens. But if the Strait of Hormuz remains blocked for more than a few weeks, those same nations lose their primary export route. On June 9, credit default swaps on Saudi Arabia’s five-year sovereign debt widened from 48 to 72 basis points, a move that implies the market has begun to reassess the foundational assumption that Gulf states are insulated from the region’s violence.
People Also Ask: How does the Middle East war affect global stock markets?
An escalation in the Middle East drives up oil prices and volatility, triggering a flight to safe havens such as gold and US Treasuries. Stock markets fall on fears of supply disruptions and higher inflation, with energy-importing nations and interest-rate-sensitive sectors suffering most. Historically, equity markets recover once the immediate supply threat diminishes, but the speed of algorithmic trading now amplifies the initial drawdown.
Yet what distinguishes this episode from, say, the 1990 Gulf War or the 2003 Iraq invasion is the speed of the sell-off and the breadth of the asset classes involved. In 1990, the S&P 500 took 53 trading days to fall 15%. This time, that move required fewer than eight hours. The compression of time frames is partly a function of market structure — ETFs, 0DTE options, automated market makers — but it’s also a reflection of an investor base that has been conditioned to “buy the dip” on every geopolitical scare since Crimea 2014. When the dip keeps deepening, and when the supply shock is real rather than merely feared, the behavioural feedback loop snaps.
Second-order effects: the central bank conundrum
Financial markets may be the most visible arena of disruption, but the second-order effects will unfold inside central bank boardrooms. The eurozone, which imports more than 90% of its oil, faces an acute stagflationary impulse. The European Central Bank had, as recently as its June 4 policy meeting, signalled a pause in its rate-cutting cycle after bringing the deposit rate to 2.75%. A sustained oil price of $120 per barrel would, according to the [OECD’s June 2026 Interim Economic Outlook](https://www.oecd.org/economic-outlook/), add 1.4 percentage points to euro-area headline inflation within six months while slicing 0.6 percentage points from GDP growth. President Christine Lagarde must now choose between tolerating a longer inflation overshoot or tightening into a demand shock — precisely the dilemma that haunted the ECB in 2008 and 2011. Her public remarks on June 9, in which she called for “steadiness and patience,” were parsed by traders as code for a prolonged hold, and the euro fell below $1.04 for the first time since November 2022.
For the US Federal Reserve, the calculus is different but no less treacherous. The United States is now a net energy exporter, meaning the oil shock acts as a transfer from consumers to domestic producers rather than a pure terms-of-trade loss. However, the dollar’s sharp appreciation and the global risk-off cascade have tightened financial conditions by an amount equivalent, by some estimates, to 50 basis points of additional Fed tightening. Chair Jay Powell, who is scheduled to appear before the Senate Banking Committee on June 18, will be pressed to explain whether the Fed can separate the inflationary impulse of higher energy costs from the disinflationary force of a slowing global economy. Markets, for now, have erased all expectations of a July rate cut and are pricing a 30% chance of a quarter-point increase by September.
Emerging markets carry the heaviest burden. Central banks in Turkey, Pakistan, and Egypt convened emergency meetings on June 9. All three raised benchmark rates — Turkey’s by a staggering 400 basis points to 52% — to stem capital outflows and currency depreciation. The Institute of International Finance reported that portfolio outflows from emerging-market equities and bonds reached $28 billion in the first two trading days of the week, the largest such exodus since the taper tantrum of 2013. The human dimension of those numbers is stark: for a country like Pakistan, which spends roughly 40% of its import bill on energy, a $120 oil price and a strengthening dollar could deplete its remaining $8.3 billion in foreign reserves within five months, according to an internal finance ministry note seen by Reuters.
A competing view: this, too, shall pass
Not everyone is convinced the sky is falling. A cohort of strategists and historians argue that financial markets have a long record of overreacting to Middle East conflicts, and that the underlying economic damage is often shallower than the initial price action implies. Lina al-Hassan, chief strategist at EFG Hermes in Dubai, issued a note to clients on June 9 titled “Why We’re Buying the Dip — Cautiously.” She pointed out that in 12 of the last 15 major Middle East military escalations since 1990, the S&P 500 was higher three months after the event than it was on the day of the initial shock. Her analysis, grounded in data from MSCI and Refinitiv, shows that while energy stocks and defence contractors rally, the broader market typically recovers once the Pentagon deploys naval assets that restore some degree of freedom of navigation. By June 9 afternoon, the US Navy had confirmed that the aircraft carrier USS Gerald R. Ford was transiting the Bab el-Mandeb strait, a signal that Washington intends to keep at least one chokepoint open.
Al-Hassan’s argument is not that the situation is benign. “This is a serious crisis,” she told me in a phone call. “But the market’s job is to price probabilities, and the probability that Hormuz stays closed for a period long enough to cause a global recession is still below 40%.” She noted that the Iran-Iraq War of the 1980s, in which both sides attacked tankers and mined the Gulf, never succeeded in fully closing the Strait for more than a few days at a time. The strategic reality, she insists, is that Iran cannot sustain a prolonged closure without devastating its own economy and inviting a military response that would far exceed anything it could withstand.
There is merit in this counterargument. The US Fifth Fleet and its allies have overwhelming naval superiority. Iran’s mining operations are provocation, not an indefinite blockade strategy. And financial markets have indeed developed a remarkable capacity to absorb geopolitical shocks since the Cold War’s end. Still, what troubles even the optimists is the amplification machinery that the BIS and others have documented. In 1990, when Iraq invaded Kuwait, high-frequency trading did not exist, ETFs were a niche product, and the dollar-swap obligations of non-bank financial institutions were a rounding error. Today, those mechanisms can turn a manageable supply disruption into a systemic margin spiral. “The difference between 2026 and 1990,” al-Hassan conceded, “is that the plumbing can now burn the house down before the fire department even arrives.”
The reckoning
The conflict in the Middle East has, in a handful of days, forced global financial markets to confront an uncomfortable truth: the post-Cold War assumption that great-power competition would remain largely contained to cyber and proxy domains has expired. Physical chokepoints matter again. Energy weaponisation is back as a first-order macro variable. And the financial system’s own internal amplifiers — leverage, derivatives, algorithmic crowding — are primed to convert a regional war into a global margin call with breathtaking speed.
This is not 1973, when an oil embargo reshaped the geopolitical order, nor is it 2008, when a credit collapse exposed the hubris of financial engineering. It’s something messier: a hybrid crisis in which a 20th-century-style supply shock is being processed through a 21st-century financial architecture that rewards speed over resilience. The policymakers who must navigate this — from Lagarde and Powell to the governors in Ankara and Islamabad — are operating with fogged-up instruments and constrained mandates. The single number that best captures their dilemma may not be the price of Brent crude or the level of the VIX, but a figure buried in the footnotes of the BIS’s latest data: global dollar-denominated debt held by non-banks outside the United States now stands at $14.9 trillion. When the dollar surges and liquidity vanishes, that number becomes an anvil hanging over the world economy. The Middle East just pulled the cord.



Almost every support team is now using AI. Far fewer customers say it solves their problem. That gap is the real story of AI customer service in 2026, and it decides which deployments pay off.
Key Takeaways
- Adoption doubled fast: Salesforce’s May 2026 survey of 3,075 service professionals found AI agent adoption rose from 39% to 66% in a year. getmacha
- Results lag: Only 24% of consumers said their last AI service interaction was fully resolved by AI alone, per an Ada and NewtonX study. getmacha
- Value shows up quickly: 70% of organizations deploying agents saw measurable value within 60 days. agilebrandguide
- Data is the blocker: 72% of service operations professionals call data readiness a major obstacle. agilebrandguide
- Forecast: Gartner expects agentic AI to autonomously resolve 80% of common customer service issues by 2029. raftlabs
What “AI Customer Service” Means Now
The first wave was scripted chatbots. The current wave is agentic AI: systems that interpret open-ended intent, read live customer data and resolve issues across connected systems without following a script. cygnet
The difference is action. A chatbot answers “where’s my order?” An agent checks the order system, issues the refund and updates the CRM.
The Adoption Numbers
| Metric | Figure | Source |
|---|---|---|
| Service orgs using AI agents | 66% (up from 39%) | Salesforce, May 2026 |
| Orgs using at least one form of AI | 85% | Salesforce |
| Teams at mature AI deployment | 10% | Intercom, Jan 2026 |
| Consumers fully resolved by AI alone | 24% | Ada/NewtonX, Mar 2026 |
| Agent use across customer-facing and internal work | 77% | Salesforce |
One caution applies to the headline adoption figures: Salesforce sells AI agents for service, so it has a commercial reason to publish momentum numbers. The Salesforce data is useful, but read it as a vendor’s view. Salesforce’s own service product page promotes the AI Agents Edition report, if you want to see how it frames the findings. getmacha
The Trust Gap
The most important number in this market isn’t adoption. It’s the 24% full-resolution rate. Companies are deploying AI faster than customers are being helped by it.
One compilation of 2026 statistics adds that 64% of customers wish companies would stop using AI in customer service, according to a Lorikeet survey. That’s a single-vendor figure, so use it as a directional signal rather than a settled fact. It still matches what most people have experienced: the bot that can’t escalate, the loop that never reaches a human. coworker
Where AI service typically fails:
- No escalation path: The customer can’t reach a person.
- Stale or fragmented data: The agent can’t see order history or account status.
- Overreach: The agent attempts complex or emotional cases it shouldn’t.
- Hidden AI: Customers feel tricked when they don’t know it’s a bot.
Where It Works
AI customer service performs best on narrow, high-volume, low-emotion requests: order status, password resets, returns and refunds, appointment changes and billing questions. 95% of service professionals say they trust AI for simple requests. Trust drops sharply as complexity rises. agilebrandguide
The ROI Question
Return figures vary widely. One 2026 compilation puts average ROI at $3.50 for every $1 spent, with leading organizations reaching 8x. Treat those as ceilings, not promises. The same compilation also notes 62% of service leaders worry about unpredictable AI costs. Usage-based pricing can erase savings if volume spikes. ringlyringly
A practical ROI model needs four inputs:
- Containment rate: Share of contacts fully resolved without a human
- Cost per contact: Human-handled versus AI-handled
- Quality impact: CSAT and repeat-contact rate, not just deflection
- Total AI cost: Licenses, usage fees, integration and ongoing tuning
Deflection that frustrates customers is a hidden cost. If containment rises while CSAT falls, you’re borrowing against retention.
Platform Landscape
Enterprise buyers commonly compare these platforms: Salesforce Agentforce, IBM watsonx Assistant, Microsoft Copilot Studio, Cognigy and Kore.ai. Each has strengths, so match the platform to your stack: cygnet
| If you already run… | Consider first |
|---|---|
| Salesforce CRM | Agentforce |
| Microsoft 365 and Dynamics | Copilot Studio |
| Heavy voice and contact-center volume | Cognigy |
| Multi-function (support, IT, HR) automation | Kore.ai |
| Regulated or hybrid environments | IBM watsonx Assistant |
This table is a starting framework, not a ranking. Integration depth with your CRM and ticketing systems usually matters more than headline features.
What the Workforce Impact Looks Like
Estimates of job impact are speculative and vary by source. One forecast says Gartner predicts organizations will replace 20% to 30% of service agents with generative AI by 2026. What’s more certain is that roles change: simpler tickets disappear, and humans handle harder, more emotional cases. That requires different training and often different pay structures. raftlabs
A Buyer’s Checklist
Before signing a contract, answer these:
- Data readiness: Is customer data clean, unified and accessible to the agent?
- Escalation design: Can customers reach a human in one step?
- Transparency: Do customers know they’re talking to AI?
- Governance: Who audits agent decisions and refunds?
- Metrics: Are you tracking resolution and CSAT, not only deflection?
- Pricing: What happens to cost when volume doubles?
What’s Next
Salesforce’s research frames the next phase around governance and workforce roles, recommending clear roles for AI architects and data specialists, plus transparent interactions with clear escalation to humans. That advice is sensible regardless of vendor. agilebrandguide
The Bottom Line
AI customer service works when it’s narrow, well-fed with data and honest about its limits. It fails when companies treat it as a headcount-cutting shortcut. With adoption now past 60%, competitive advantage will come less from having AI and more from deploying it without losing customer trust. Start with simple, high-volume requests, measure resolution rather than deflection, and keep a human exit visible.
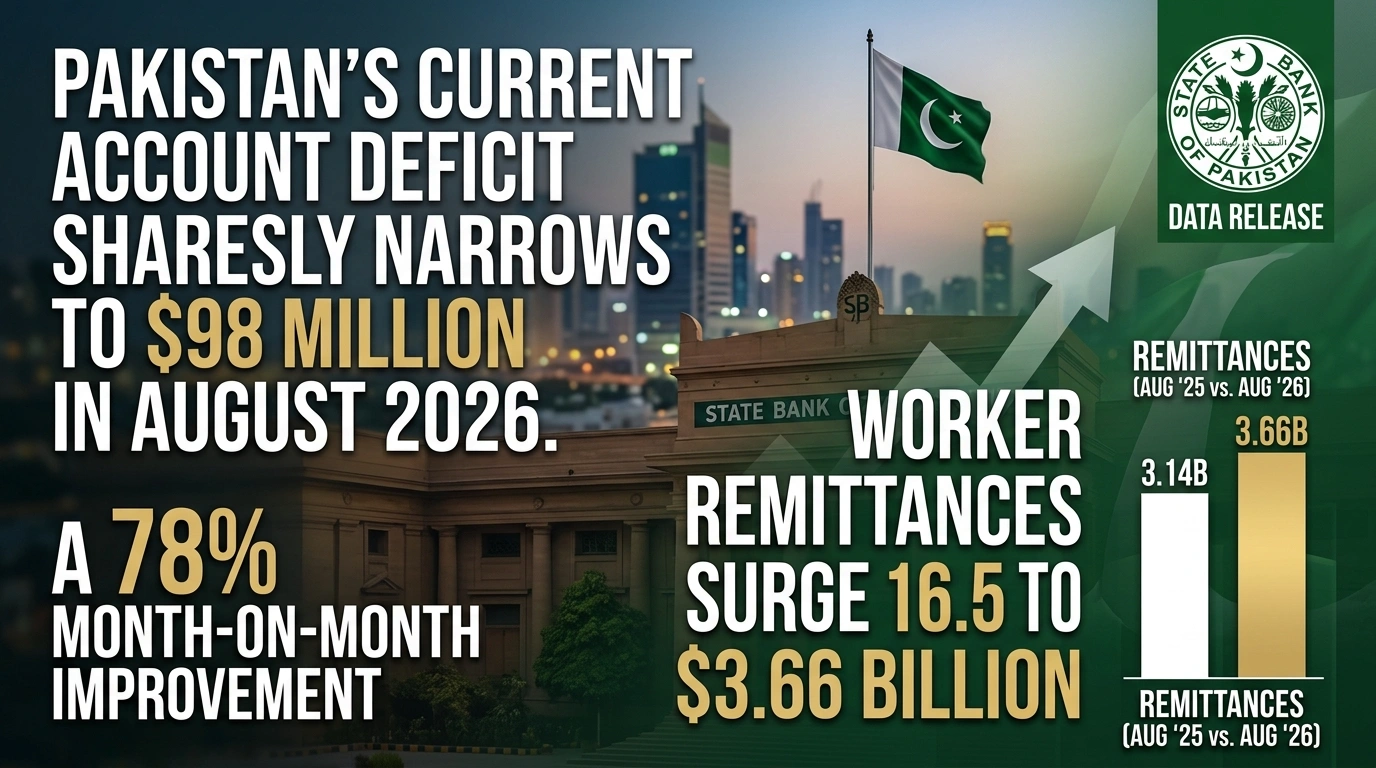
Karachi — Pakistan’s external balance demonstrated significant resilience as the monthly Current Account Deficit (CAD) contracted sharply to $98 million in August 2026, down 78% month-on-month from $445 million recorded in July 2026. Official data released by the State Bank of Pakistan (SBP) highlights that strong worker remittance inflows and steady export growth offset a surging import bill, providing crucial relief to the nation’s balance of payments.
Compared to the same period last year, the monthly shortfall narrowed by 69.7.3% from the $324 million deficit registered in August 2025. Cumulatively, during the first two months of the current fiscal year (2MFY27), Pakistan’s current account deficit stood at $543 million, marking a 36.3% reduction compared to the $853 million deficit incurred in 2MFY26, according to official economic indicators compiled by Dawn News Financial Analysis.
Key Drivers Behind August 2026 External Account Performance
1. Robust Remittance Inflows as the Core Anchor
Overseas Pakistani workers remitted $3.656 billion during August 2026, registering a 16.5% year-on-year (YoY) increase compared to $3.14 billion in August 2025 and a 0.7% month-on-month growth over July’s $3.63 billion.
- Saudi Arabia: Remained the largest contributor, accounting for $873.5 million (+19% YoY).
- United Arab Emirates (UAE): Inflows rose to $749.8 million (+17% YoY).
- United Kingdom & EU: Remittances from the UK totaled $563.7 million (+22% YoY), while European Union corridors dispatched $496 million (+7% MoM).
- United States: Inflows reached $308.9 million (+16% YoY).
Cumulative remittance inflows for 2MFY27 reached $7.29 billion, representing a 14.7% YoY increase from $6.36 billion recorded during the same period in FY26, as reported by Express Tribune Business.
2. Trade Balance and Import-Export Dynamics
- Exports of Goods & Services: Reached $3.33 billion in August 2026, reflecting a 5.0% YoY rise compared to $3.17 billion in August 2025.
- Imports of Goods & Services: Expanded to $6.64 billion, an increase of 8.0% YoY from $6.15 billion in August 2025, driven largely by essential industrial raw materials and energy imports required to support ongoing economic revival.
Macroeconomic Comparison Matrix: Current Account Breakdown
The table below illustrates the shift across key trade and primary income metrics for Pakistan’s balance of payments, as monitored by Trading Economics – Pakistan Balance of Payments:
| Economic Metric | August 2026 | July 2026 | August 2025 | 2MFY27 Cumulative | 2MFY26 Cumulative | YoY Shift (%) |
| Current Account Balance | -$98M | -$445M | -$324M | -$543M | -$853M | -36.3% |
| Worker Remittances | $3.656B | $3.630B | $3.140B | $7.286B | $6.353B | +14.7% |
| Total Exports (Goods & Services) | $3.330B | $3.180B | $3.170B | $6.510B | $6.120B | +6.37% |
| Total Imports (Goods & Services) | $6.640B | $6.520B | $6.150B | $13.160B | $12.380B | +6.30% |
| Foreign Exchange Reserves (Excl. CRR) | $17.280B | $16.900B | $14.520B | $17.280B | $14.520B | +19.0% |
| Net Foreign Direct Investment (FDI) | $315.9M | $185.2M | $175.1M | $501.1M | $342.0M | +46.5% |
Exchange Rate Competitiveness & FDI Momentum
REER and NEER Movements
Alongside the current account update, SBP data revealed that Pakistan’s Real Effective Exchange Rate (REER) index recorded a minor increase of 0.02% MoM, reaching 107.92 in August 2026 compared to 107.89 in July 2026.
Meanwhile, the Nominal Effective Exchange Rate (NEER) index depreciated by 0.79% MoM to 38.02 in August from 38.32 in July. While a REER above 100 indicates mild export price pressure, analysts cited by Reuters Global Markets note that exchange rate stability has helped maintain import predictability without severely penalizing key manufacturing sectors.
Surge in Foreign Direct Investment
Net Foreign Direct Investment (FDI) inflows saw a sharp increase, totaling $315.9 million in August 2026—an 80.4% YoY expansion compared to $175.1 million in August 2025. Key capital inflows targeted energy, telecommunications, and infrastructure projects, underscoring rising investor confidence supported by ongoing fiscal discipline and structural economic reforms monitored by Bloomberg Markets.
Macroeconomic Implications & Policy Outlook
- Foreign Reserve Buffer Expansion: Total SBP-held foreign exchange reserves (excluding CRR/SCRR) expanded to $17.28 billion, an increase of 19% YoY. This build-up strengthens Pakistan’s external liquidity buffer, providing over 2.6 months of import cover.
- Impact on Monetary Policy: The narrowing CAD and stable exchange rate dynamics offer the State Bank of Pakistan headroom to maintain a measured monetary easing cycle, encouraging domestic capital formation without reigniting demand-pull inflation.
- IMF Program Benchmark Compliance: Lower current account vulnerabilities position Pakistan favorably for ongoing review under international financial assistance programs, ensuring sustained access to multilateral funding channels.
Key Takeaways
- Japan is considering nearly doubling its midterm defense spending target to 3.5% of GDP — up from current levels of roughly 1.9% — under pressure from the Trump administration to match commitments made by NATO members and South Korea.
- A 3.5% target would amount to roughly ¥24 trillion annually, based on current GDP forecasts, more than double today’s spending level; a lower 3.0% target is also reportedly under consideration.
- Japanese 10-year government bond yields have already climbed to their highest levels since 1996, reflecting investor concern about how Japan — which carries the world’s highest debt-to-GDP ratio among advanced economies at nearly 240% — would finance the increase.
- Defense contractor stocks on the Tokyo Stock Exchange have risen in anticipation of the spending shift, even as broader market strategists warn the announcement could “send a shockwave through financial markets” concerned about PM Sanae Takaichi’s overall fiscal trajectory.
- A new five-year defense spending plan is expected by the end of 2026, meaning markets will be watching for confirmation of the final target — 3.0% or 3.5% — in the coming months.
Japan’s defense budget has broken its own record for 14 consecutive years, but the shift now under consideration in Tokyo represents something categorically different: a near-doubling of the country’s spending target, driven not by regional threat assessments alone but by direct pressure from Washington. For global economy watchers, the implications reach well beyond defense contractors into Japanese government bond markets, the yen, and the Bank of Japan’s already delicate policy path.
The New Target Under Consideration
According to people familiar with the matter, Japan’s government — under Prime Minister Sanae Takaichi — is weighing a new midterm defense spending target of 3.5% of GDP, aligning with commitments already made by NATO members and, more strikingly, by South Korea, which has pledged to reach that level over 10 years. Japanese defense officials have reportedly already signaled willingness to sharply increase spending in meetings with their US counterparts, though a lower 3.0% target remains an alternative under discussion.
To put the scale of this shift in context: until 2022, Japan maintained an informal spending ceiling around just 1% of GDP — a figure rooted in the country’s post-war pacifist constitutional framework. Takaichi has already accelerated Japan toward the more modest 2% target two years ahead of schedule, reaching nearly that level in the fiscal year ended March 2026. A jump to 3.5% would represent roughly ¥24 trillion in annual spending based on current GDP projections — more than double the current outlay, and a figure that dwarfs the roughly ¥9-10 trillion currently being requested for the next fiscal year’s defense budget alone.
Why Now: US Pressure and the NATO Benchmark
The push traces directly to the Trump administration’s broader effort to have allies shoulder more of their own defense costs and reduce reliance on the American military umbrella. The 3.5%-of-GDP figure has effectively become a global benchmark for US allies since NATO members adopted it, with Japan’s neighbors South Korea and Taiwan reportedly making similar pledges. For Tokyo specifically, the pressure carries added urgency given ongoing regional security concerns and the broader reassessment of US alliance commitments happening globally in 2026.
Notably, even Takaichi’s more modest current-year progress — nearing 2% of GDP two years ahead of schedule — already drew praise in Washington, but analysts at the Center for Strategic and International Studies have noted this success is likely to raise expectations for even further increases in Japan’s next defense buildup program, expected to be finalized by the end of 2026.
The Fiscal Math Problem
Japan’s fiscal starting position makes this proposal considerably more fraught than a simple budget-line adjustment. The country already carries the world’s highest debt-to-GDP ratio among advanced economies, at nearly 240% — meaning any large new spending commitment raises immediate questions about financing, whether through new bond issuance, tax increases, or some combination. Takaichi has publicly pledged to pursue a “responsible, proactive fiscal policy,” but bond markets are already signaling skepticism: Japanese 10-year government bond yields have climbed to their highest levels since 1996, reflecting growing investor concern about debt sustainability even before any formal 3.5% commitment is finalized.
Bond Market and Equity Reaction
The market response so far has bifurcated in a telling way. On one hand, major Japanese defense companies have risen on the Tokyo Stock Exchange as investors price in the prospect of substantially higher government contracts. On the other, the broader bond market reaction has been notably more cautious — rising JGB yields reflect concern that large new debt issuance to fund the buildup could strain Japan’s already stretched fiscal position, with potential knock-on effects for borrowing costs across the economy.
Spending Target Comparison
| Scenario | Target (% of GDP) | Est. Annual Spending | Status |
|---|---|---|---|
| Pre-2022 informal ceiling | ~1.0% | N/A | Historical baseline |
| Current target (achieved early) | ~2.0% | ~¥9-10 trillion | Reached FY2026, 2 years ahead of schedule |
| Under consideration (lower option) | 3.0% | N/A | Reportedly discussed |
| Under consideration (NATO-aligned option) | 3.5% | ~¥24 trillion | Reportedly discussed; matches South Korea’s 10-year pledge |
Why This Matters for the BOJ and Global Markets
A defense-spending shift of this magnitude complicates an already difficult picture for the Bank of Japan, which has been gradually moving away from decades of ultra-loose monetary policy even as it monitors the same Middle East-driven inflation pressures affecting central banks globally. Rising JGB yields tied to defense-spending concerns could interact with — and potentially amplify — the BOJ’s separate rate-hike considerations tied to domestic inflation, creating a more complex policy balancing act than either factor would present alone.
There’s also a broader global bond-market angle: some strategists have pointed to Japan’s rising rates as a factor behind a potential unwinding of the long-popular yen carry trade, in which investors borrow cheaply in Japan to invest in higher-yielding assets elsewhere. As Japanese yields climb — whether from defense spending, BOJ policy, or both — that trade becomes progressively less attractive, a dynamic some analysts have linked to recent volatility in global government bond markets more broadly, including the US Treasury market’s own yield surge this same week.
Frequently Asked Questions
Why is Japan considering raising defense spending to 3.5% of GDP?
The shift is driven primarily by pressure from the Trump administration for US allies to spend more on their own defense, aligning with commitments already made by NATO members and Japan’s neighbor South Korea, which pledged to reach 3.5% of GDP over 10 years.
How would Japan pay for a defense spending increase to 3.5% of GDP?
This remains unresolved and is a major market concern — Japan already carries the world’s highest debt-to-GDP ratio among advanced economies at nearly 240%, and rising Japanese government bond yields suggest investors are pricing in financing concerns ahead of any formal commitment.
When will Japan finalize its new defense spending target?
A new five-year defense spending plan is expected to be released by the end of 2026, which should clarify whether Japan settles on the 3.0% or 3.5% of GDP target currently under consideration.

Pakistan Freelancers Tax 2026: Payments, Documentation and Formal Growth

Strait of Hormuz Crisis: What the Latest Tanker Attacks Mean for Oil, Shipping and Global Trade

AI Customer Service in 2026: What’s Working, What’s Failing, and What to Buy

Open a Savings Account Online: How to Actually Earn 10x the National Average Rate

Global Housing Market 2026: Where Prices Rise, Where They Don’t

PSX and KSE-100 Record Highs: An Insider’s Guide to Pakistan Stocks

So Delicious Dessert Recall: Affected Products, FDA Guidelines, and Consumer Action

Pakistan’s Current Account Deficit Narrows Sharply to $98 Million in August 2026

Japan Eyes 3.5% Defense Spending: What It Means for Bonds, Stocks, and the BOJ

PSX & KSE Forecast 2026: Navigating the Latest IMF Reports & World Bank Metrics

Trump Administration’s Crypto Policy: Deregulation and the Future of Digital Assets

Monetary Policy and the Policy Rate

Gold, Silver & Bitcoin Prices Q4 2026: Wealth Management Strategies

Business Insurance for Digital Exports: Protecting Your Company in the AI Era

Top 15 Stocks for Investment in 2026 in PSX: Your Complete Guide to Pakistan’s Best Investment Opportunities
Top 15 Stocks for Investment in 2026 in PSX: Your Complete Guide to Pakistan’s Best Investment Opportunities

Debunking IMF Program Myths: Reconfiguring Engagement for True National Ownership in a Volatile World

Top 10 Mutual Fund Managers in Pakistan for Investment in 2026: A Comprehensive Guide for Optimal Returns

China’s 50% Domestic Equipment Rule: The Semiconductor Mandate Reshaping Global Tech

What the U.S. Attack on Venezuela Could Mean for Oil and Canadian Crude Exports: The Economic Impact

15 Most Lucrative Sectors for Investment in Pakistan: A 2025 Data-Driven Analysis

Pakistan’s Export Goldmine: 10 Game-Changing Markets Where Pakistani Businesses Are Winning Big in 2025
15 Most Lucrative Sectors for Investment in Pakistan: A 2025 Data-Driven Analysis

Pakistan’s Stock Market Renaissance: How 2025’s Hottest Investment Opportunity Is Democratizing Wealth—A Complete Beginner’s Guide
15 Most Lucrative Sectors for Investment in Pakistan: A 2025 Data-Driven Analysis

How to Become an Active Taxpayer on Pakistan’s FBR Active Taxpayer List (ATL) in 2026: A Step-by-Step Guide

Pakistan’s Economic Outlook 2025: Between Stabilization and the Shadow of Stagnation

Best Investments in Pakistan 2026: Top 10 Low-Price Shares and Long-Term Picks for the PSX
-
 Markets & Finance10 months ago
Top 15 Stocks for Investment in 2026 in PSX: Your Complete Guide to Pakistan’s Best Investment Opportunities
-
Markets & Finance10 months ago
Top 15 Stocks for Investment in 2026 in PSX: Your Complete Guide to Pakistan’s Best Investment Opportunities
-
 Analysis9 months ago
Debunking IMF Program Myths: Reconfiguring Engagement for True National Ownership in a Volatile World
-
 Investment9 months ago
Top 10 Mutual Fund Managers in Pakistan for Investment in 2026: A Comprehensive Guide for Optimal Returns
-
 Asia10 months ago
China’s 50% Domestic Equipment Rule: The Semiconductor Mandate Reshaping Global Tech
-
 Global Economy10 months ago
What the U.S. Attack on Venezuela Could Mean for Oil and Canadian Crude Exports: The Economic Impact
-
 AI10 months ago
15 Most Lucrative Sectors for Investment in Pakistan: A 2025 Data-Driven Analysis
-
 Exports10 months ago
Pakistan’s Export Goldmine: 10 Game-Changing Markets Where Pakistani Businesses Are Winning Big in 2025