
Global Economy
What the U.S. Attack on Venezuela Could Mean for Oil and Canadian Crude Exports: The Economic Impact

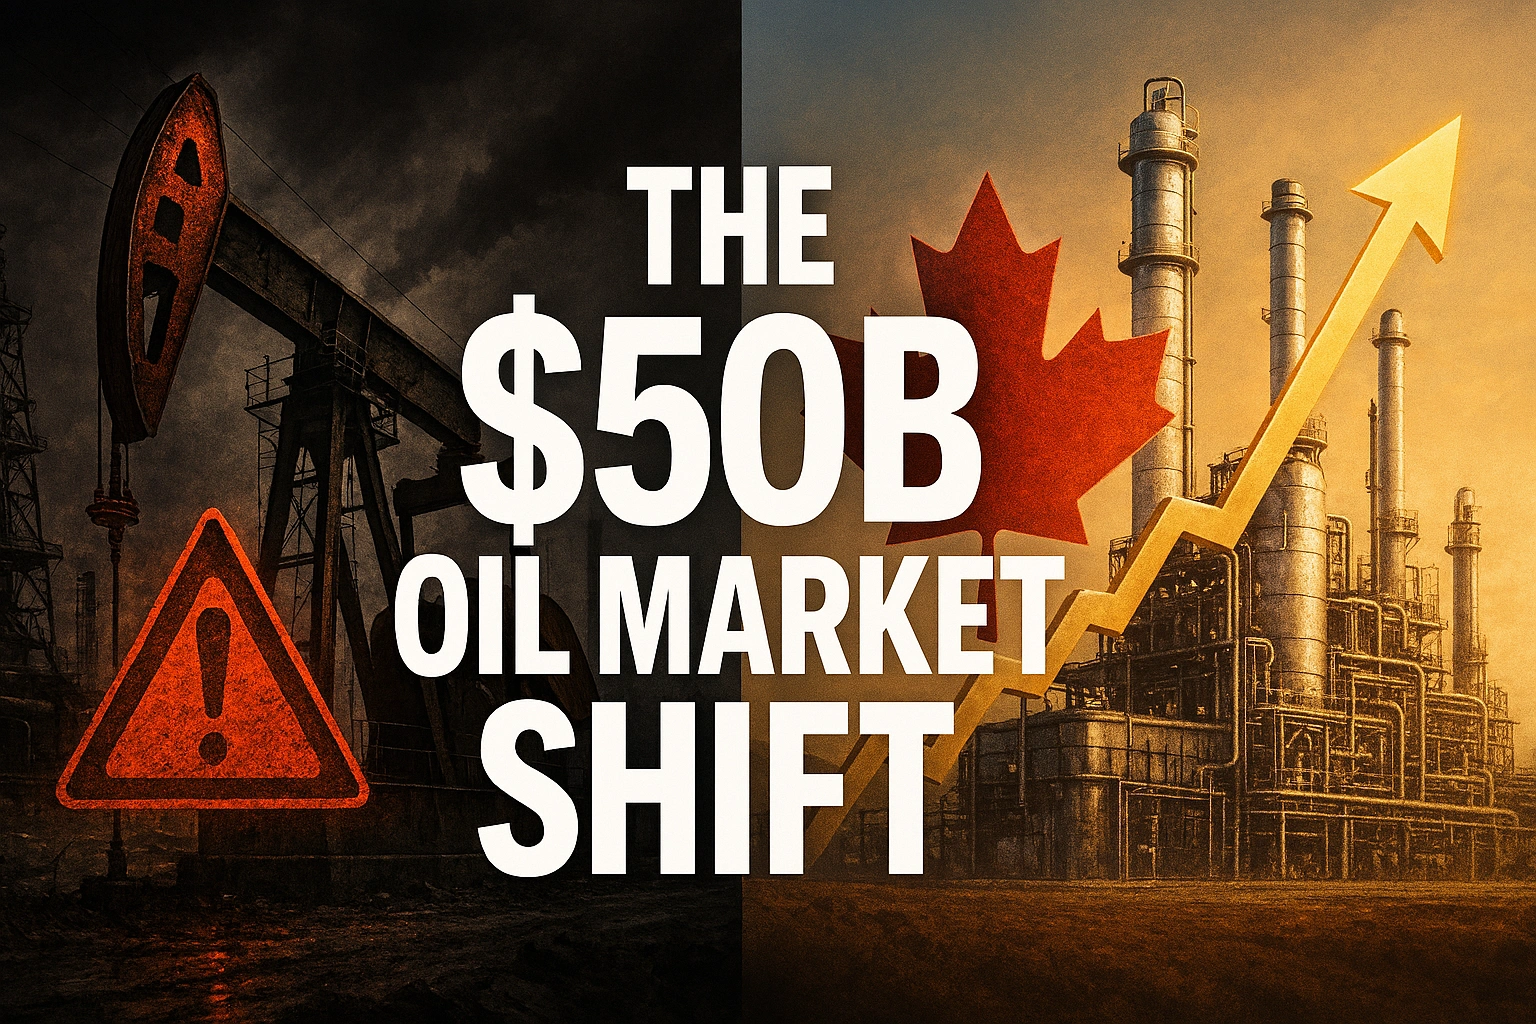
The aggressive U.S. pressure campaign against Venezuela’s oil sector is reshaping North American energy markets in ways few anticipated. The U.S. Treasury Department sanctioned four companies and oil tankers on December 31, 2025, as part of President Trump’s intensifying blockade against the Maduro regime, triggering a domino effect that positions Canada as an unexpected beneficiary in the global crude oil trade.
Here’s what this geopolitical shake-up means for oil prices, supply chains, and the $150 billion Canadian energy sector—and why investors, refiners, and policymakers are watching closely.
Understanding the U.S.-Venezuela Oil Relationship
The Escalating Sanctions Campaign
The Trump administration has sanctioned multiple vessels and companies involved in Venezuela’s shadow fleet operations, disrupting what remains of the country’s oil export capability. This isn’t just diplomatic posturing—it represents a fundamental disruption to hemispheric energy flows that have existed for decades.
Venezuela exports less than 1 million barrels per day, a small fraction of the 106 million barrels per day global oil market, according to analysis from the Center for Strategic and International Studies. Yet the strategic importance of Venezuelan heavy crude far exceeds its volume.
Venezuela’s Diminished Production Capacity
Venezuela’s oil production topped 3 million barrels per day in the early 2000s but has fallen sharply in recent decades due to declining investment and U.S. sanctions. The country once held the world’s largest proven oil reserves, but production infrastructure has deteriorated dramatically under years of economic mismanagement and international isolation.
Rebuilding Venezuela’s oil infrastructure would require investments of more than $100 billion and take at least a decade to lift production to 4 million barrels per day, according to Francisco Monaldi, director of the Latin America energy program at Rice University.
The Immediate Impact on Global Oil Markets
Gulf Coast Refineries Face a Critical Supply Gap
The reality facing U.S. refiners is more complex than simple supply and demand. Gulf Coast refiners favor heavy crude like Mexican Maya, as they typically run medium and heavy oil configurations, according to Wood Mackenzie analysis. Venezuelan heavy crude has historically filled a specific niche—high sulfur content, low API gravity—that perfectly matches the coking capabilities of sophisticated Gulf Coast refineries.
Gulf Coast refinery utilization started 2025 at 93% but has drifted to the mid-80% range as several mid-sized refineries cut runs by 5% to 10%. This decline isn’t entirely about Venezuelan supply disruptions—oversupply of light crude from the Permian Basin and compressed refining margins play significant roles—but the loss of heavy crude optionality constrains operational flexibility.
Price Volatility Remains Muted Despite Geopolitical Tensions
A continuing crackdown could throttle most or all of Venezuela’s exports and associated revenues, yet less than 20 percent of Venezuelan crude exports are transported on shadow tankers—a smaller proportion than Russian and Iranian barrels utilizing the same fleet.
West Texas Intermediate crude fell to $57.32 a barrel in January 2026, down from nearly $80 in January 2025, demonstrating that broader market factors currently outweigh Venezuela-specific disruptions. The International Energy Agency projects the oil market could see a surplus of 3.8 million barrels per day in 2026—the largest glut since the pandemic.
The Diesel Dilemma
There’s one product where Venezuelan supply matters disproportionately: diesel fuel. Venezuela produces a form of crude suitable for making diesel, which is widely used across industries. Removing Venezuela’s oil input from global markets could push up diesel costs in the U.S. and boost inflation, according to Atlantic Council analysis.
This creates an interesting paradox. While overall crude oil supply remains abundant, specific refined product markets could tighten, creating regional price dislocations that sophisticated traders will exploit.
Canada’s Strategic Opportunity in the Energy Landscape
Western Canadian Select Emerges as the Alternative
Enter Canada—and specifically, Western Canadian Select heavy crude. The characteristics that once made WCS a challenging product to market now make it invaluable. With API gravity between 20.5 and 21.5 degrees and sulfur content of 3.0 to 3.5 percent, WCS offers similar processing characteristics to Venezuelan crude.
The WTI-WCS price differential narrowed from $18.65 per barrel in 2023 to $14.73 per barrel in 2024, attributed to the commissioning of the Trans Mountain Pipeline Expansion in May 2024, according to the Alberta Energy Regulator.
The differential has been trading in a tight band between $10.25 and $11.70 under WTI since September 2025, with analysts pointing to strong international buying of Canadian crude off the Pacific coast. Even with seasonal widening, these differentials represent historically favorable pricing for Canadian producers.
Trans Mountain Pipeline: The Game-Changing Infrastructure
The Trans Mountain Pipeline Expansion isn’t just another infrastructure project—it fundamentally rewires North American energy geography. The expansion increased capacity from 300,000 to 890,000 barrels per day, nearly tripling throughput and increasing total western Canadian crude oil export pipeline capacity by 13%.
Within the first 12 months of operation, average pipeline movements of crude oil from Alberta to British Columbia increased more than fivefold, with total crude oil volumes exported through British Columbia surging by more than sixfold, according to Statistics Canada data.
The geographic diversification is remarkable. From May 2024 to April 2025, crude oil shipments to non-U.S. destinations accounted for 48.1% of exports by volume from British Columbia, compared to 100% going to the U.S. in the previous 12-month period.
Production Capacity Ramping Aggressively
Canadian crude oil production rose 9.4% year-over-year to 150 million barrels in January 2025, with exports totaling 129 million barrels, up from 125.5 million barrels a year earlier, according to data from Mansfield Energy citing Statistics Canada.
This production growth trajectory positions Canada as one of the most significant non-OPEC+ crude output growth stories globally. Oil sands producers are capitalizing on improved market access, ramping up production to fill new pipeline capacity.
Economic Implications for North America
U.S. Energy Security Gets More Complex
The U.S. relationship with Canadian crude isn’t simply transactional—it’s deeply integrated through decades of infrastructure investment and refinery optimization. In 2022, 79.2 percent of Canada’s refined oil came from the U.S., with Canadian crude refined in the Midwest and then sold back to Canada and the rest of the world, according to data from the Observatory of Economic Complexity.
This creates a fascinating interdependency. As Venezuela falls further out of the supply picture, U.S. refiners need Canadian heavy crude more than ever. Yet simultaneously, Canadian producers have new leverage through Pacific export options that didn’t exist two years ago.
The U.S. tariff threat that dominated headlines in early 2025 demonstrated this tension. Under the tariff case, the WCS price was expected to be 18% below the base case forecast at $45 per barrel due to a 10% U.S. tariff on Canadian energy products, resulting in a widening WCS-WTI differential.
Canadian Economic Growth Projections Improve
Since the expanded Trans Mountain pipeline came online, non-U.S. oil exports rose from about 2.5 percent of total exports to about 6.5 percent, according to Alberta Central economist Charles St-Arnaud. This diversification reduces Canada’s vulnerability to U.S. market dynamics and policy uncertainty.
The Alberta government expects the average WTI price to be $76.50 US, up $2.50 US per barrel from originally forecast, demonstrating the economic significance of improved market access.
The multiplier effects extend beyond direct oil revenues. Pipeline operations, tanker loading facilities, refinery upgrades, and related services generate substantial employment and tax revenue across Western Canada.
Investment Flows Redirect Northward
Canadian production is averaging five million barrels per day as of July 2025—up from 4.8 million in 2023—and is set to grow further into 2026, according to ATB Financial. This production growth requires billions in capital investment across the oil sands complex.
Energy analyst Rory Johnston projects year-over-year growth of 100,000 to 300,000 barrels per day through 2025, making Canada one of the largest sources of crude output growth globally. In a world where major international oil companies face pressure to constrain capital deployment, Canadian oil sands represent one of the few jurisdictions seeing significant production increases.
Geopolitical Ramifications Beyond North America
China Emerges as Canada’s Largest Pacific Buyer
China has become the top buyer of Canadian oil via the Trans Mountain pipeline at 207,000 barrels per day—a massive increase from an average of 7,000 barrels per day in the decade to 2023, according to Institute for Energy Research data.
This shift carries profound implications. Chinese refiners gain access to reliable heavy crude supplies outside U.S. jurisdictional reach, reducing their dependence on sanctioned sources like Iran and Venezuela. For Canada, Chinese demand provides price support and market optionality that didn’t exist when the U.S. was effectively the only customer.
Chinese oil purchases through the port near Vancouver soared to more than seven million barrels in March 2025 and were on pace to exceed that figure in April, while Chinese imports of U.S. oil dropped to three million barrels a month from 29 million barrels in June 2024.
Regional Stability Questions in Latin America
The U.S. seizure of shadow fleet tankers demonstrates that Washington is willing to physically halt exports of sanctioned oil, potentially throttling most or all of Venezuela’s exports. This aggressive enforcement creates precedents that extend beyond Venezuela.
Russia and China face outsized vulnerabilities in a world of greater sanctions enforcement that may include physical seizures. Washington’s actions could inspire other sanctioning authorities to implement similar operations, particularly in strategic chokepoints like the Danish straits.
OPEC+ Calculations Shift
Venezuela’s production decline removes a historically significant OPEC member from market balancing equations. While current Venezuelan output is modest, the country’s vast reserves and potential production capacity have always factored into long-term OPEC+ strategy.
Canada isn’t an OPEC member and has no production coordination with the cartel. Increased Canadian output essentially represents non-OPEC supply growth that OPEC+ must account for in its own production decisions. This dynamic could contribute to persistent oversupply conditions that depress prices.
Challenges and Risks Ahead
Infrastructure Bottlenecks Remain
Canadian crude exports from the Trans Mountain pipeline fell to 407 thousand barrels per day in June 2025, down 10.5% from May and 23.5% below the March record of 532 thousand barrels per day, according to Kpler data.
Peak seasonal maintenance and wildfire-related production disruptions that began in late May caused the decline, while strong inland U.S. demand from the Midwest and Gulf Coast reduced export availability. These operational realities demonstrate that even with new infrastructure, Canadian exports face constraints.
Enbridge Mainline was apportioned 4% in June 2025, with further apportionment expected in July, as demand from the Midwest and Gulf Coast competes for the same crude pool.
Environmental and Regulatory Headwinds
Canadian oil sands remain among the most carbon-intensive crude sources globally. As climate policies tighten—particularly in key markets like California and the European Union—carbon intensity creates both regulatory risk and reputational challenges.
California’s low-carbon fuel standards explicitly penalize high-carbon crude sources. While Asian buyers currently show less concern about carbon intensity, this could change as climate policies evolve. The $34 billion Trans Mountain expansion faced years of environmental opposition, demonstrating that future infrastructure projects will face significant regulatory hurdles.
Market Volatility Creates Planning Uncertainty
Oil prices fell to $57.32 per barrel in January 2026, dropping roughly 20% in 2025 and extending a decline over the previous two years. This price environment challenges the economics of capital-intensive oil sands development.
Oil sands projects require multi-billion-dollar investments with decades-long payback periods. Price volatility makes financial planning extraordinarily difficult. While improved market access through Trans Mountain helps, it doesn’t eliminate exposure to global price cycles.
Trans Mountain has become one of the most expensive routes for oil shippers due to toll increases necessary to cover construction cost overruns exceeding $34 billion. Higher transportation costs eat into producer netbacks, reducing the competitiveness of Canadian crude.
Expert Predictions and Future Outlook
Growing Asian Demand for Heavy Crude
Market analysts project continued growth in Asian demand for Canadian heavy crude, particularly as refineries complete infrastructure adaptations and develop expertise in processing oil sands products. This represents a fundamental shift in global crude trade flows.
Chinese and Indian refiners have invested billions in coking capacity specifically designed to handle heavy, high-sulfur crudes. As these facilities ramp up, they create structural demand for exactly the type of crude Canada produces in abundance.
Infrastructure Expansion Plans
Trans Mountain Corp is reviewing expansion projects for the line, with goals of increasing exports to Asian markets by adding between 200,000 and 300,000 barrels per day of capacity. Most of this additional capacity would likely target Asian rather than U.S. West Coast markets.
These expansion plans indicate confidence in long-term demand, but they also face the same political and environmental challenges that made the initial Trans Mountain expansion so contentious. Whether Canada can sustain the political will to approve major new energy infrastructure remains uncertain.
Long-Term Supply-Demand Balance Questions
Based on futures markets, the average price for WTI in 2026 is roughly $61 per barrel, down from the 2024 average of $76 per barrel, largely driven by concerns of slowing demand and an escalating global trade war, according to CAPP analysis.
The fundamental challenge facing the oil industry is that supply growth—from the U.S. shale, Canadian oil sands, Brazilian pre-salt, and Guyana—continues outpacing demand growth. Even with Venezuelan production effectively removed from the market, global oversupply persists.
This creates a paradoxical situation: Canadian producers gain market share and improve their strategic position while operating in an environment of depressed prices and margin pressure.
Key Takeaways: What This Means for Stakeholders
For U.S. Refiners: The loss of Venezuelan heavy crude creates dependency on Canadian and Mexican sources. Smart refiners are securing long-term Canadian crude supply contracts while the market remains oversupplied.
For Canadian Producers: The Trans Mountain expansion has created genuine optionality and improved netbacks, but success requires continued production efficiency improvements and market development in Asia.
For Investors: Canadian energy companies with low-cost oil sands operations and strong balance sheets look increasingly attractive. The sector faces headwinds from overall price weakness but structural advantages from improved market access.
For Policymakers: Energy security considerations increasingly favor North American supply chains. The U.S.-Canada energy relationship, despite periodic tensions, represents a strategic asset in an uncertain geopolitical environment.
For Asia’s Energy Buyers: Canadian crude offers reliable supply outside U.S. sanctions risk, though at the cost of higher transportation expenses and carbon intensity concerns.
The Bottom Line
The U.S. pressure campaign against Venezuela is accelerating a transformation already underway in North American energy markets. Canada isn’t simply filling a gap left by Venezuelan supply disruptions—it’s fundamentally repositioning as a globally connected crude exporter with options beyond its traditional U.S.-centric model.
The WTI-WCS price differential is anticipated to average $11 per barrel in 2025 as Trans Mountain enters its first full calendar year of operation. This represents the narrowest differential in years and reflects improved market access.
Yet significant uncertainties remain. Trade policy tensions between the U.S. and Canada could resurface. Global oil demand growth faces headwinds from electric vehicle adoption and efficiency improvements. Climate policies could penalize carbon-intensive crude sources.
What’s clear is that the era of Canadian crude as a captive supply to U.S. refineries has ended. The strategic implications of this shift—for energy security, geopolitics, and market dynamics—will play out over the coming decade.
For now, Canadian producers are capitalizing on a unique moment: Venezuelan production constrained by sanctions, new export infrastructure creating Asian market access, and global refiners seeking reliable heavy crude supplies. Whether this opportunity translates into sustained economic benefits depends on execution, market conditions, and policy developments that remain highly uncertain.
Frequently Asked Questions
Q: What is the impact of US sanctions on Venezuelan oil?
The U.S. has sanctioned multiple companies and vessels in Venezuela’s shadow fleet, disrupting the country’s ability to export crude oil and generating revenue for the Maduro regime. These sanctions effectively cut Venezuela off from most international oil markets, though some exports continue through sanctions evasion.
Q: How will Canadian crude exports benefit from the Venezuela situation?
Canadian crude benefits through five key mechanisms:
- Reduced competition from Venezuelan heavy crude in Gulf Coast refineries
- Trans Mountain Pipeline providing Asian market access
- Narrower price differentials due to improved market access
- Increased production justified by reliable export capacity
- Strategic positioning as a sanctions-free alternative to Venezuelan supply
Q: Why do Gulf Coast refineries need heavy crude oil?
Gulf Coast refineries invested billions in coking and conversion units specifically designed to process heavy, high-sulfur crude into valuable products like gasoline and diesel. These complex refinery configurations achieve higher margins when processing discounted heavy crude rather than more expensive light crude, making heavy crude supplies strategically important to their operations.



Barclays reported second-quarter income of £8.3 billion, up £1.2 billion from a year earlier, and upgraded its full-year 2026 income target even as operating expenses climbed 7% year-on-year — a mixed but ultimately reassuring signal for UK banking-sector health as the country navigates elevated gilt yields and a new premiership.
Income Growth Outpaces a Rise in Costs
Barclays reported second-quarter operating expenses of £4.5 billion, up 7% year-on-year, which the bank attributed to business growth, inflation, and increased investment spending, according to CNBC’s markets coverage. Despite the cost increase, income rose to £8.3 billion, and adjusted earnings per share beat Wall Street consensus, prompting shares to initially react positively before falling more than 7% amid broader market volatility on the results day.
Group Chief Executive C.S. Venkatakrishnan struck a confident tone on the outlook, saying the bank was upgrading its 2026 Group income target to approximately £31.5 billion and remained committed to delivering all financial and distribution targets through 2028, according to the same CNBC report.
Why the Results Matter Beyond Barclays
The results land at a delicate moment for UK financial markets more broadly. Ten-year gilt yields have been trading near 5% amid uncertainty over new Prime Minister Andy Burnham’s fiscal programme, while 30-year yields — sensitive to long-term fiscal credibility — have hovered near multi-year highs. A major UK bank posting income growth and raising its full-year guidance amid that backdrop offers a data point suggesting the underlying corporate and consumer credit environment remains healthier than the gilt market’s elevated risk pricing might suggest on its own.
Context: A Resilient Consumer Backdrop
Barclays’ results also arrive alongside broader UK data that has surprised to the upside. UK retail sales rose 1% in June against expectations for a 0.3% decline, while consumer confidence climbed to a six-month high in July, supported by warmer weather and a spending lift tied to the football World Cup — trends that plausibly support the credit and transaction-fee income underpinning Barclays’ income beat. Annual consumer price inflation, meanwhile, slowed to a 15-month low of 2.6% in June, giving the Bank of England room to hold interest rates steady at its policy meeting this week.
The Cost Pressure Story Isn’t Unique to Barclays
The 7% rise in Barclays’ operating expenses reflects a broader pattern across UK banking: inflation-driven wage costs, continued investment in technology and compliance infrastructure, and the general cost of doing business in a higher-rate environment. How rival UK lenders navigate the same pressures in their own upcoming results will be a key signal of whether Barclays’ income upgrade reflects bank-specific execution strength or a sector-wide tailwind from resilient consumer activity.
What to Watch
Barclays’ upgraded £31.5 billion income target sets a clear benchmark against which the rest of 2026 results will be measured, while the sustainability of the current cost growth rate — set against a Bank of England policy backdrop still calibrated around inflation risk — will determine whether margin expansion continues into 2027. Investors will also be watching how the bank’s guidance holds up if gilt-market volatility around the new government’s fiscal plans intensifies.
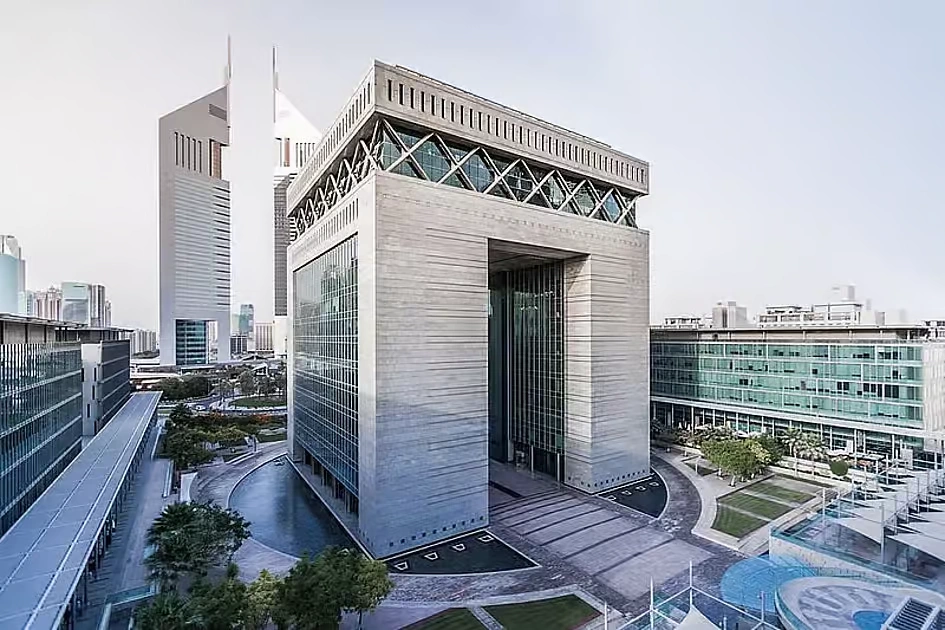
Dubai has climbed to its highest position ever on one of finance’s most closely watched rankings, and the achievement is no accident — it is the direct output of a decade-long, numerically explicit government strategy that few other financial centres have attempted to execute with this level of precision.
The Ranking Itself
The Dubai International Financial Centre has recorded its highest-ever position on the Global Financial Centres Index at seventh place worldwide, the highest ranking ever achieved by any financial centre across the Middle East, Africa and South Asia region, and the only MEASA-region centre to feature in the global top 20 — underscoring both its regional dominance and genuine global competitiveness.
The D33 Strategy Behind the Number
The ranking is explicitly tied to Dubai’s own stated ambitions. The GFCI result is described as pivotal to Dubai’s goal of becoming one of the world’s top four financial centres by 2033, in line with the Dubai Economic Agenda, or D33, which targets a doubling of the emirate’s economy over the decade. Separately, Dubai Chambers has confirmed the plan targets cumulative economic output of AED 32 trillion, or roughly $8.7 trillion, over the decade, supported by 100 transformative projects centred on trade expansion, digital innovation and sustainable growth.
The Underlying Economic Engine
The financial-centre ambitions are backed by genuine current-quarter growth. Dubai’s economy reached AED 232 billion in first-quarter 2026 GDP, a 2.4 percent year-on-year increase, with the finance, construction, healthcare, wholesale and retail trade, and real estate sectors all contributing to the broad-based expansion. Middle East Briefing separately projects the wider UAE economy will expand around 5 percent in 2026, with local banks positioned to increase lending both domestically — supporting SMEs, consumers and project finance — and across borders into markets like Saudi Arabia, where UAE banks’ comparatively lower interbank rates create an arbitrage opportunity.
Real Money Behind the Ranking
The GFCI climb is being validated by tangible transaction volume rather than sentiment alone. Weekly UAE business tracking shows a steady drumbeat of institutional activity: Sharjah Islamic Bank reported AED 803.9 million in net profit, up 15.3 percent, ADI Chain secured a $50 million investment to build sovereign digital infrastructure, and Capital.com reported $1.1 trillion in second-quarter trading volume routed through the jurisdiction. Separately, UAE and Saudi banks are projected to lead GCC credit growth in 2026, reinforcing Dubai and Abu Dhabi’s combined position as the region’s default financial gateway.
Why This Matters for Pakistan and South Asia
Dubai’s ascent as a financial hub carries direct relevance for Pakistan, where — as detailed in our companion coverage of Pakistan’s remittance exposure — roughly 55 percent of the country’s substantial remittance inflows originate from the Gulf Cooperation Council. A deepening, increasingly sophisticated DIFC-anchored financial ecosystem in Dubai means more efficient, lower-cost channels for that capital, alongside growing opportunities for Pakistani and South Asian firms to access GCC-sourced project finance and cross-border credit as UAE banks expand lending beyond their domestic market.
What is Dubai’s global financial centre ranking in 2026?
Dubai’s DIFC recorded its highest-ever ranking on the Global Financial Centres Index at 7th place worldwide in 2026 — the highest ever achieved by any Middle East, Africa or South Asia financial centre — as part of its stated goal to become a top-four global financial hub by 2033.
The Risk Beneath the Growth Story
Not every signal points to unambiguous strength. AGBI’s own reporting notes that UAE banks’ second-quarter results are likely to show weaker profits, slower lending and narrower margins, even as analysts characterise the underlying sector as fundamentally resilient — a reminder that Dubai’s financial-hub ambitions are being pursued against a genuinely more difficult regional operating environment shaped by the Strait of Hormuz disruption and broader Gulf security concerns, not in isolation from them.
The Bottom Line
Dubai’s climb to seventh in the GFCI rankings is less a one-off achievement than a measurable checkpoint on an explicitly numbered, decade-long strategic roadmap — one increasingly backed by real GDP growth, credit expansion, and institutional trading volume rather than ambition alone.
Analysis
Global Central Bank Divergence 2026: Why the Fed, BoE, BoJ, and PBoC Are All Moving Differently

The world’s major central banks are no longer moving in anything resembling lockstep. The Federal Reserve is watching a weakening labor market while weighing energy-driven inflation risk, the Bank of Japan is scaling back bond purchases into a fiscal expansion, the Bank of Russia is cutting rates through sanctions-driven stagnation, and the Bank of England is openly discussing a hike rather than the cuts it signaled just months ago, a divergence in global monetary policy that reflects how unevenly the Iran war’s economic shock has landed across different economies.
The Fed’s Data-Dependent Pivot
Federal Reserve Chairman Kevin Warsh has explicitly asked markets to look to incoming data rather than central bank guidance to map the path for US interest rates, a communication shift that took on new significance after June’s jobs report showed just 57,000 new positions, roughly half the expected pace, according to Yahoo Finance’s markets coverage. Warsh has separately said inflation risks have eased substantially, a combination that has markets betting on a more accommodative Fed even as the central bank has offered no formal commitment ahead of its July 30 decision.
The Bank of England’s Reversal
Few central banks illustrate the scale of the pivot as clearly as the Bank of England. Governor Andrew Bailey said market pricing for two rate cuts this year had looked reasonable before the Iran war lifted inflation risks, according to the Credit Protection Association’s reporting, a statement that effectively closed the door on the easing path the Bank had signaled entering 2026. With UK inflation forecast to climb back toward 3.5% by year end and the base rate held at 3.75%, RSM UK’s analysis suggests a hike, not a cut, is now the more live possibility for the Bank’s July 30 decision, timed to land the same day as the Fed’s own announcement.
Canada and the Bank of Canada’s Cautious Hold
The Bank of Canada has held its policy rate at 2.25% since the spring, balancing a genuinely fragile domestic economy, technically in recession by some measures, against the same energy-driven inflation pressure affecting the UK, according to the central bank’s own announcement. Unlike the Fed or Bank of England, the Bank of Canada’s dilemma is compounded by an unresolved CUSMA trade review, meaning its policy path depends as much on trade negotiation outcomes as on conventional inflation and employment data.
Russia’s Disinflation Campaign, Slowed but Not Abandoned
At the opposite extreme sits the Bank of Russia, which has cut its key rate eight consecutive times since June 2025, from a record 21% down to 14.25% by its June 2026 decision, even as annual inflation remains at 5.6%, well above its 4% target, according to the central bank’s own data. Governor Elvira Nabiullina’s cutting cycle reflects a fundamentally different set of pressures than Western central banks face: a wartime economy where fiscal policy, not conventional demand, drives the inflation picture, and where the central bank’s June cut of just 25 basis points, smaller than the market’s expected 50, signals genuine caution about cutting too fast into persistent pro-inflationary risk from higher domestic energy costs.
Asia’s Split Response
Indonesia and Malaysia illustrate how differently emerging Asian economies are navigating the same global energy shock. Bank Indonesia has held its rate at 4.75% for seven consecutive meetings specifically to defend the rupiah, which has weakened 3.6% year-to-date, according to McKinsey’s regional review, prioritizing currency stability over the growth-supportive easing its 5.61% GDP growth might otherwise justify. Bank Negara Malaysia, by contrast, has benefited from a currency that has held relatively firm, giving it more flexibility, though inflation drifting toward the top of its 1.5% to 2.5% target range, per The Edge Malaysia’s reporting, suggests that flexibility may narrow through the second half of the year.
Japan sits furthest from the rest of the pack. The Bank of Japan has been reducing its own bond purchases even as 10-year Japanese government bond yields have climbed above 2.75%, their highest level since May 2026, according to Trading Economics, a tightening-adjacent move driven as much by concern over Prime Minister Sanae Takaichi’s fiscal expansion plans as by conventional inflation targeting.
China’s Different Problem Entirely
China’s central bank faces a problem none of its peers share: six consecutive quarters of deflation rather than inflation. Societe Generale economist Wei Yao has suggested Chinese bond yields could fall to record lows in 2026 as the People’s Bank of China continues easing, a view consistent with Beijing’s own base case of roughly RMB 1 trillion in additional fiscal stimulus alongside 20 basis points of rate cuts and 50 basis points of reserve requirement ratio cuts, according to Citi Research’s 2026 outlook, cited via Asia Times’ coverage of the Politburo’s domestic demand pivot.
What This Divergence Actually Means
The practical consequence of seven major central banks pursuing seven distinct policy paths is a global capital markets environment where currency volatility, carry trade dynamics, and cross-border capital flows have become considerably harder to forecast using any single macro framework. When Japan’s ultra-low yields anchored global borrowing costs and most Western central banks moved in broad cyclical alignment, currency and rate forecasting rested on relatively stable assumptions about global monetary conditions. That anchor is now gone. Investors positioning across UK gilts, US Treasurys, Japanese government bonds, and emerging Asian debt in the second half of 2026 face a genuinely fragmented policy landscape, one where the same global shock, the Iran war’s energy price spike, has produced hikes, holds, and cuts in near-equal measure depending entirely on each economy’s starting fiscal position, currency exposure, and domestic political constraints.

Business Insurance for Digital Exports: Protecting Your Company in the AI Era

Real Estate Crash Predictions 2026: Data-Backed Regional Guide

What is a “Lead-Left” Bank? Unpacking Morgan Stanley’s Role in Anthropic’s Mega-IPO

Is SPY Overvalued in September 2026? Fed Rate Hike Odds & Intrinsic Value

Pakistan’s KSE-100 Nears Record Territory Even as the Trade Gap Persists

US Consumer Sentiment Sinks as Retail Sales Drop

Barclays Q2 2026 Results: Income Beats, Costs Rise 7%

Pakistan’s Remittance Lifeline: Why Gulf Exposure Is a Hidden Risk

Dubai’s Rise to the World’s 7th Financial Hub: Inside the D33 Push

China EV Exports Hit Record High in 2026

UK’s “National Contributions Tax” Explained: Burnham-Era Reform 2026

Russia’s Strange Problem in 2026: Its Currency Is Too Strong

Section 301 Forced Labor Tariffs 2026: 60 Countries Affected

UK National Contributions Tax: Burnham’s Radical Tax Plan

Top 15 Stocks for Investment in 2026 in PSX: Your Complete Guide to Pakistan’s Best Investment Opportunities
Top 15 Stocks for Investment in 2026 in PSX: Your Complete Guide to Pakistan’s Best Investment Opportunities

Debunking IMF Program Myths: Reconfiguring Engagement for True National Ownership in a Volatile World

Top 10 Mutual Fund Managers in Pakistan for Investment in 2026: A Comprehensive Guide for Optimal Returns

What the U.S. Attack on Venezuela Could Mean for Oil and Canadian Crude Exports: The Economic Impact

China’s 50% Domestic Equipment Rule: The Semiconductor Mandate Reshaping Global Tech

15 Most Lucrative Sectors for Investment in Pakistan: A 2025 Data-Driven Analysis

Pakistan’s Export Goldmine: 10 Game-Changing Markets Where Pakistani Businesses Are Winning Big in 2025
15 Most Lucrative Sectors for Investment in Pakistan: A 2025 Data-Driven Analysis
15 Most Lucrative Sectors for Investment in Pakistan: A 2025 Data-Driven Analysis

Pakistan’s Stock Market Renaissance: How 2025’s Hottest Investment Opportunity Is Democratizing Wealth—A Complete Beginner’s Guide

Pakistan’s Economic Outlook 2025: Between Stabilization and the Shadow of Stagnation
Pakistan’s Economic Outlook 2025: Between Stabilization and the Shadow of Stagnation

China’s Property Woes Could Last Until 2030—Despite Beijing’s Best Censorship Efforts
-
 Markets & Finance8 months ago
Top 15 Stocks for Investment in 2026 in PSX: Your Complete Guide to Pakistan’s Best Investment Opportunities
-
Markets & Finance8 months ago
Top 15 Stocks for Investment in 2026 in PSX: Your Complete Guide to Pakistan’s Best Investment Opportunities
-
 Analysis7 months ago
Debunking IMF Program Myths: Reconfiguring Engagement for True National Ownership in a Volatile World
-
 Investment8 months ago
Top 10 Mutual Fund Managers in Pakistan for Investment in 2026: A Comprehensive Guide for Optimal Returns
-
 Asia8 months ago
China’s 50% Domestic Equipment Rule: The Semiconductor Mandate Reshaping Global Tech
-
 AI9 months ago
15 Most Lucrative Sectors for Investment in Pakistan: A 2025 Data-Driven Analysis
-
 Exports9 months ago
Pakistan’s Export Goldmine: 10 Game-Changing Markets Where Pakistani Businesses Are Winning Big in 2025
-
AI9 months ago
15 Most Lucrative Sectors for Investment in Pakistan: A 2025 Data-Driven Analysis