
Analysis
Pakistan’s Current Account Deficit Narrows Sharply to $98 Million in August 2026

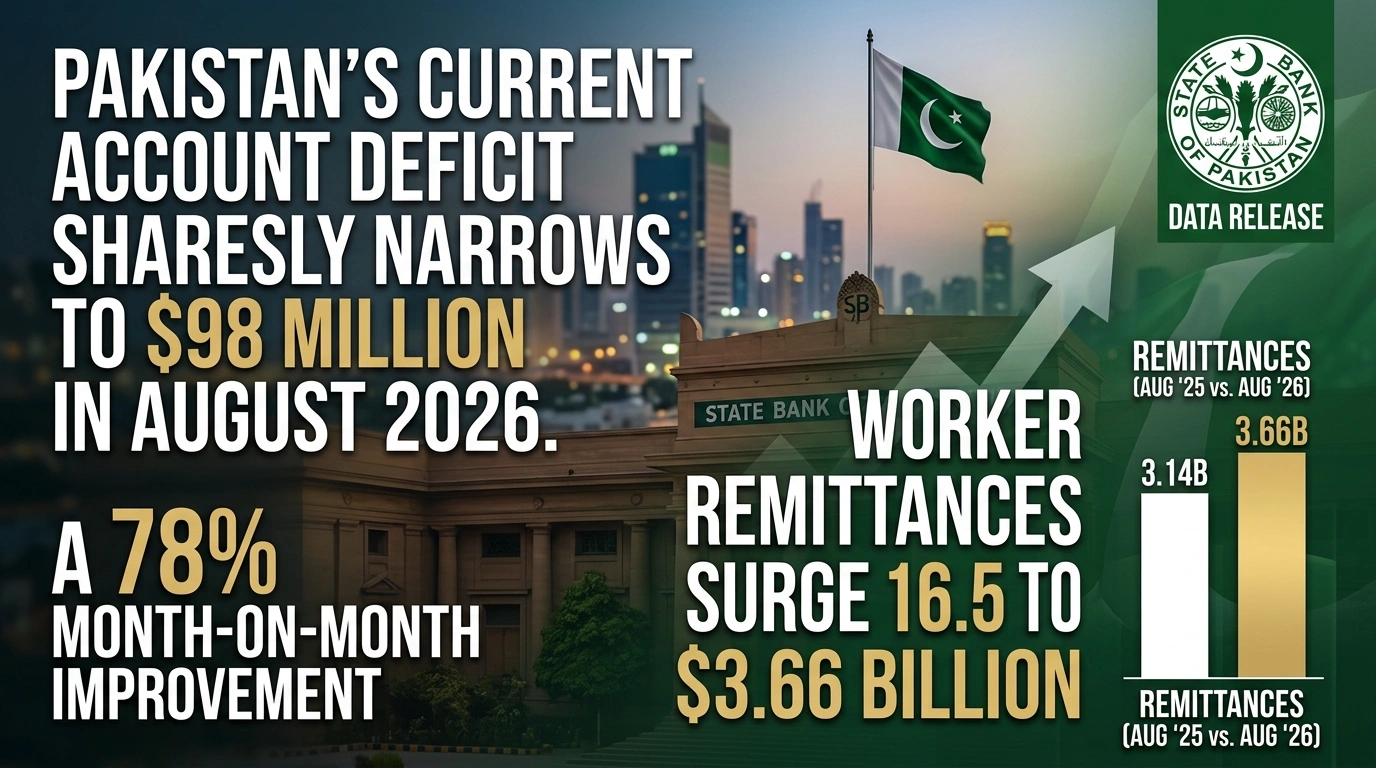
Karachi — Pakistan’s external balance demonstrated significant resilience as the monthly Current Account Deficit (CAD) contracted sharply to $98 million in August 2026, down 78% month-on-month from $445 million recorded in July 2026. Official data released by the State Bank of Pakistan (SBP) highlights that strong worker remittance inflows and steady export growth offset a surging import bill, providing crucial relief to the nation’s balance of payments.
Compared to the same period last year, the monthly shortfall narrowed by 69.7.3% from the $324 million deficit registered in August 2025. Cumulatively, during the first two months of the current fiscal year (2MFY27), Pakistan’s current account deficit stood at $543 million, marking a 36.3% reduction compared to the $853 million deficit incurred in 2MFY26, according to official economic indicators compiled by Dawn News Financial Analysis.
Key Drivers Behind August 2026 External Account Performance
1. Robust Remittance Inflows as the Core Anchor
Overseas Pakistani workers remitted $3.656 billion during August 2026, registering a 16.5% year-on-year (YoY) increase compared to $3.14 billion in August 2025 and a 0.7% month-on-month growth over July’s $3.63 billion.
- Saudi Arabia: Remained the largest contributor, accounting for $873.5 million (+19% YoY).
- United Arab Emirates (UAE): Inflows rose to $749.8 million (+17% YoY).
- United Kingdom & EU: Remittances from the UK totaled $563.7 million (+22% YoY), while European Union corridors dispatched $496 million (+7% MoM).
- United States: Inflows reached $308.9 million (+16% YoY).
Cumulative remittance inflows for 2MFY27 reached $7.29 billion, representing a 14.7% YoY increase from $6.36 billion recorded during the same period in FY26, as reported by Express Tribune Business.
2. Trade Balance and Import-Export Dynamics
- Exports of Goods & Services: Reached $3.33 billion in August 2026, reflecting a 5.0% YoY rise compared to $3.17 billion in August 2025.
- Imports of Goods & Services: Expanded to $6.64 billion, an increase of 8.0% YoY from $6.15 billion in August 2025, driven largely by essential industrial raw materials and energy imports required to support ongoing economic revival.
Macroeconomic Comparison Matrix: Current Account Breakdown
The table below illustrates the shift across key trade and primary income metrics for Pakistan’s balance of payments, as monitored by Trading Economics – Pakistan Balance of Payments:
| Economic Metric | August 2026 | July 2026 | August 2025 | 2MFY27 Cumulative | 2MFY26 Cumulative | YoY Shift (%) |
| Current Account Balance | -$98M | -$445M | -$324M | -$543M | -$853M | -36.3% |
| Worker Remittances | $3.656B | $3.630B | $3.140B | $7.286B | $6.353B | +14.7% |
| Total Exports (Goods & Services) | $3.330B | $3.180B | $3.170B | $6.510B | $6.120B | +6.37% |
| Total Imports (Goods & Services) | $6.640B | $6.520B | $6.150B | $13.160B | $12.380B | +6.30% |
| Foreign Exchange Reserves (Excl. CRR) | $17.280B | $16.900B | $14.520B | $17.280B | $14.520B | +19.0% |
| Net Foreign Direct Investment (FDI) | $315.9M | $185.2M | $175.1M | $501.1M | $342.0M | +46.5% |
Exchange Rate Competitiveness & FDI Momentum
REER and NEER Movements
Alongside the current account update, SBP data revealed that Pakistan’s Real Effective Exchange Rate (REER) index recorded a minor increase of 0.02% MoM, reaching 107.92 in August 2026 compared to 107.89 in July 2026.
Meanwhile, the Nominal Effective Exchange Rate (NEER) index depreciated by 0.79% MoM to 38.02 in August from 38.32 in July. While a REER above 100 indicates mild export price pressure, analysts cited by Reuters Global Markets note that exchange rate stability has helped maintain import predictability without severely penalizing key manufacturing sectors.
Surge in Foreign Direct Investment
Net Foreign Direct Investment (FDI) inflows saw a sharp increase, totaling $315.9 million in August 2026—an 80.4% YoY expansion compared to $175.1 million in August 2025. Key capital inflows targeted energy, telecommunications, and infrastructure projects, underscoring rising investor confidence supported by ongoing fiscal discipline and structural economic reforms monitored by Bloomberg Markets.
Macroeconomic Implications & Policy Outlook
- Foreign Reserve Buffer Expansion: Total SBP-held foreign exchange reserves (excluding CRR/SCRR) expanded to $17.28 billion, an increase of 19% YoY. This build-up strengthens Pakistan’s external liquidity buffer, providing over 2.6 months of import cover.
- Impact on Monetary Policy: The narrowing CAD and stable exchange rate dynamics offer the State Bank of Pakistan headroom to maintain a measured monetary easing cycle, encouraging domestic capital formation without reigniting demand-pull inflation.
- IMF Program Benchmark Compliance: Lower current account vulnerabilities position Pakistan favorably for ongoing review under international financial assistance programs, ensuring sustained access to multilateral funding channels.



Key Takeaways
- Japan is considering nearly doubling its midterm defense spending target to 3.5% of GDP — up from current levels of roughly 1.9% — under pressure from the Trump administration to match commitments made by NATO members and South Korea.
- A 3.5% target would amount to roughly ¥24 trillion annually, based on current GDP forecasts, more than double today’s spending level; a lower 3.0% target is also reportedly under consideration.
- Japanese 10-year government bond yields have already climbed to their highest levels since 1996, reflecting investor concern about how Japan — which carries the world’s highest debt-to-GDP ratio among advanced economies at nearly 240% — would finance the increase.
- Defense contractor stocks on the Tokyo Stock Exchange have risen in anticipation of the spending shift, even as broader market strategists warn the announcement could “send a shockwave through financial markets” concerned about PM Sanae Takaichi’s overall fiscal trajectory.
- A new five-year defense spending plan is expected by the end of 2026, meaning markets will be watching for confirmation of the final target — 3.0% or 3.5% — in the coming months.
Japan’s defense budget has broken its own record for 14 consecutive years, but the shift now under consideration in Tokyo represents something categorically different: a near-doubling of the country’s spending target, driven not by regional threat assessments alone but by direct pressure from Washington. For global economy watchers, the implications reach well beyond defense contractors into Japanese government bond markets, the yen, and the Bank of Japan’s already delicate policy path.
The New Target Under Consideration
According to people familiar with the matter, Japan’s government — under Prime Minister Sanae Takaichi — is weighing a new midterm defense spending target of 3.5% of GDP, aligning with commitments already made by NATO members and, more strikingly, by South Korea, which has pledged to reach that level over 10 years. Japanese defense officials have reportedly already signaled willingness to sharply increase spending in meetings with their US counterparts, though a lower 3.0% target remains an alternative under discussion.
To put the scale of this shift in context: until 2022, Japan maintained an informal spending ceiling around just 1% of GDP — a figure rooted in the country’s post-war pacifist constitutional framework. Takaichi has already accelerated Japan toward the more modest 2% target two years ahead of schedule, reaching nearly that level in the fiscal year ended March 2026. A jump to 3.5% would represent roughly ¥24 trillion in annual spending based on current GDP projections — more than double the current outlay, and a figure that dwarfs the roughly ¥9-10 trillion currently being requested for the next fiscal year’s defense budget alone.
Why Now: US Pressure and the NATO Benchmark
The push traces directly to the Trump administration’s broader effort to have allies shoulder more of their own defense costs and reduce reliance on the American military umbrella. The 3.5%-of-GDP figure has effectively become a global benchmark for US allies since NATO members adopted it, with Japan’s neighbors South Korea and Taiwan reportedly making similar pledges. For Tokyo specifically, the pressure carries added urgency given ongoing regional security concerns and the broader reassessment of US alliance commitments happening globally in 2026.
Notably, even Takaichi’s more modest current-year progress — nearing 2% of GDP two years ahead of schedule — already drew praise in Washington, but analysts at the Center for Strategic and International Studies have noted this success is likely to raise expectations for even further increases in Japan’s next defense buildup program, expected to be finalized by the end of 2026.
The Fiscal Math Problem
Japan’s fiscal starting position makes this proposal considerably more fraught than a simple budget-line adjustment. The country already carries the world’s highest debt-to-GDP ratio among advanced economies, at nearly 240% — meaning any large new spending commitment raises immediate questions about financing, whether through new bond issuance, tax increases, or some combination. Takaichi has publicly pledged to pursue a “responsible, proactive fiscal policy,” but bond markets are already signaling skepticism: Japanese 10-year government bond yields have climbed to their highest levels since 1996, reflecting growing investor concern about debt sustainability even before any formal 3.5% commitment is finalized.
Bond Market and Equity Reaction
The market response so far has bifurcated in a telling way. On one hand, major Japanese defense companies have risen on the Tokyo Stock Exchange as investors price in the prospect of substantially higher government contracts. On the other, the broader bond market reaction has been notably more cautious — rising JGB yields reflect concern that large new debt issuance to fund the buildup could strain Japan’s already stretched fiscal position, with potential knock-on effects for borrowing costs across the economy.
Spending Target Comparison
| Scenario | Target (% of GDP) | Est. Annual Spending | Status |
|---|---|---|---|
| Pre-2022 informal ceiling | ~1.0% | N/A | Historical baseline |
| Current target (achieved early) | ~2.0% | ~¥9-10 trillion | Reached FY2026, 2 years ahead of schedule |
| Under consideration (lower option) | 3.0% | N/A | Reportedly discussed |
| Under consideration (NATO-aligned option) | 3.5% | ~¥24 trillion | Reportedly discussed; matches South Korea’s 10-year pledge |
Why This Matters for the BOJ and Global Markets
A defense-spending shift of this magnitude complicates an already difficult picture for the Bank of Japan, which has been gradually moving away from decades of ultra-loose monetary policy even as it monitors the same Middle East-driven inflation pressures affecting central banks globally. Rising JGB yields tied to defense-spending concerns could interact with — and potentially amplify — the BOJ’s separate rate-hike considerations tied to domestic inflation, creating a more complex policy balancing act than either factor would present alone.
There’s also a broader global bond-market angle: some strategists have pointed to Japan’s rising rates as a factor behind a potential unwinding of the long-popular yen carry trade, in which investors borrow cheaply in Japan to invest in higher-yielding assets elsewhere. As Japanese yields climb — whether from defense spending, BOJ policy, or both — that trade becomes progressively less attractive, a dynamic some analysts have linked to recent volatility in global government bond markets more broadly, including the US Treasury market’s own yield surge this same week.
Frequently Asked Questions
Why is Japan considering raising defense spending to 3.5% of GDP?
The shift is driven primarily by pressure from the Trump administration for US allies to spend more on their own defense, aligning with commitments already made by NATO members and Japan’s neighbor South Korea, which pledged to reach 3.5% of GDP over 10 years.
How would Japan pay for a defense spending increase to 3.5% of GDP?
This remains unresolved and is a major market concern — Japan already carries the world’s highest debt-to-GDP ratio among advanced economies at nearly 240%, and rising Japanese government bond yields suggest investors are pricing in financing concerns ahead of any formal commitment.
When will Japan finalize its new defense spending target?
A new five-year defense spending plan is expected to be released by the end of 2026, which should clarify whether Japan settles on the 3.0% or 3.5% of GDP target currently under consideration.

The New Risk Frontier of Digital Exports
As software, AI models, digital media, and cross-border SaaS platforms dominate global trade, traditional commercial property and casualty insurance is no longer sufficient. Digital exporters face complex liabilities ranging from cross-border data privacy breaches and algorithmic bias claims to intellectual property infringement in foreign jurisdictions. In 2026, protecting a borderless digital enterprise requires specialized insurance coverage tailored to intangible asset risks.
Failing to secure robust digital export insurance can expose founders and shareholders to catastrophic lawsuits originating from overseas regulatory bodies.
Essential Coverages for Digital Export Enterprises
Cyber Liability and Algorithmic Error Coverage
If an AI model or software product exported overseas malfunctions or suffers a data breach, foreign regulators can levy severe fines under regional privacy laws. Modern cyber policies cover both regulatory defense costs and third-party damages.
Intellectual Property and Copyright Defense
Digital creators and SaaS firms operating globally are frequent targets of frivolous IP litigation in unfamiliar legal systems. Specialized IP insurance covers the exorbitant legal fees required to defend international patents and copyrights.
| Insurance Policy Type | Primary Protection Area | Target Enterprise | Average Annual Premium |
| Global Cyber Liability | Data breaches, ransomware, AI output errors | SaaS & AI Platforms | $5,000 – $18,000 |
| E&O Professional Liability | Service failures, missed deliverables | Digital Consultancies & Agencies | $3,000 – $10,000 |
| International IP Defense | Foreign copyright & patent lawsuits | Software Developers & Creators | $7,000 – $25,000 |
Securing Comprehensive Coverage: Best Practices
Navigating the insurance market for digital exports requires partnering with specialized brokers who understand intangible asset exposures.
Audit Geographic Exposures: Clearly map where your digital users reside to ensure your policy covers those specific regulatory jurisdictions.
Verify AI Exclusion Clauses: Carefully review policy wording to ensure your generative AI or automated tools are not explicitly excluded from coverage.
Maintain Incident Response Protocols: Insurers offer lower premiums to firms that demonstrate rigorous cybersecurity and data governance standards.
“Risk Management Expert Note: Your software may be intangible, but your liability in foreign markets is entirely real. Comprehensive digital export insurance is the ultimate shield for borderless growth.”
Equipping your digital export enterprise with specialized insurance safeguards your balance sheet and ensures uninterrupted global expansion.

If you’ve followed coverage of Anthropic’s reported IPO preparations, you’ve likely seen a specific phrase repeated across Financial Times and Bloomberg reporting: Morgan Stanley is said to hold the “pole position” for the lead-left role on the offering. It sounds like insider jargon — and it is — but understanding what it actually means reveals a lot about how the largest IPOs in history get priced, sold, and stabilized after they start trading.
Key Takeaways
- “Lead-left” refers to the underwriting bank listed first on the cover page of an IPO prospectus — traditionally positioned on the left side of the page.
- The lead-left bank runs the bookbuilding process, sets the final offer price alongside the issuer, and typically earns the largest share of underwriting fees.
- Morgan Stanley reportedly holds the inside track for this role on Anthropic’s IPO, with Goldman Sachs running “neck-and-neck” for a top-tier co-lead position.
- JPMorgan, Citigroup, and Barclays are expected to round out the broader underwriting syndicate.
- The same three lead banks — Morgan Stanley, Goldman Sachs, JPMorgan — ran the book on the SpaceX IPO in June 2026, the current record holder for largest offering ever.
- For investors, the lead-left bank’s decisions directly shape share allocation, pricing discipline, and after-market stability.
The Origin of the Term (and Why It Still Matters)
The “lead-left” designation dates back to a literal physical convention: on the cover page of a printed IPO prospectus, underwriting banks are listed in order of importance, with the most senior bank’s name and logo positioned on the far left. Over decades, “lead-left” became shorthand for the bank running point on the entire transaction — even as prospectuses moved from print to digital filings.
Today, being lead-left signals to the market that a bank has taken primary responsibility for:
- Bookbuilding — soliciting and aggregating orders from institutional investors during the roadshow
- Price discovery — synthesizing investor demand into a final offer price recommendation for the issuer’s board
- Fee allocation — typically claiming the largest cut of the total underwriting discount, often in the 20–40% range of total fees depending on syndicate structure
- Stabilization — managing after-market trading support, including exercising the “greenshoe” over-allotment option to buy back shares if the stock trades below the offer price shortly after listing
Why the Role Matters More in a Deal This Size
For a conventional mid-sized IPO, the lead-left designation is largely an internal Wall Street prestige marker. For a deal of Anthropic’s reported scale — targeting a valuation near $2 trillion, which would rival or exceed SpaceX’s record-setting June 2026 debut — the stakes are dramatically higher.
A misjudged offer price on a deal this large can produce two very different bad outcomes:
- Underpricing: If shares are priced too conservatively relative to demand, the company leaves substantial capital on the table, and early flippers capture gains that could have gone to the company’s own balance sheet.
- Overpricing: If shares are priced too aggressively, the stock can “break issue” — trading below its offer price shortly after listing — which damages investor confidence and can make it harder for the company to raise capital in follow-on offerings.
SpaceX’s own trajectory illustrates this tension well: shares priced at $135, reaching a first-day peak near a $2.1 trillion market cap, before settling into a range closer to $1.5 trillion by late July. Managing that kind of post-listing volatility responsibly falls disproportionately on the lead-left bank’s trading desk.
Morgan Stanley vs. Goldman Sachs: Why Both Are in the Running
Reporting indicates Morgan Stanley and Goldman Sachs are “running neck-and-neck” for top billing on Anthropic’s deal — a genuinely competitive situation rather than a formality. Both banks bring distinct strengths:
| Factor | Morgan Stanley | Goldman Sachs |
|---|---|---|
| Prior AI-sector IPO experience | Co-led SpaceX (June 2026) | Co-led SpaceX (June 2026) |
| Institutional distribution network | Extensive global wealth management arm | Deep institutional and sovereign wealth relationships |
| Existing Anthropic relationship | Reported prior debt financing role | Reported prior debt financing role |
| Technology sector banking franchise | Historically strong in large-cap tech | Historically strong in large-cap tech and growth equity |
In practice, mega-deals of this size increasingly use joint lead-left structures or closely shared top billing, which allows the issuer to tap both banks’ distribution networks without fully subordinating either one — a structure that may ultimately be how Anthropic’s deal resolves this specific competitive tension.
How This Connects to Anthropic’s Debt Financing
It’s not coincidental that the banks reportedly competing for Anthropic’s lead underwriting roles are the same institutions that previously provided the company debt financing, and are now reportedly structuring a $15 billion pre-IPO credit facility. This dual relationship gives whichever bank secures lead-left status unusually deep, pre-existing visibility into Anthropic’s financial position — audited or not — heading into the roadshow.
What Retail Investors Should Take Away From the Lead-Left Story
- It’s a signal of seriousness, not a valuation guarantee. A bank agreeing to lead a deal at a reported $2 trillion target valuation suggests institutional confidence in achievable demand — it does not certify that the price is fundamentally justified.
- It affects share allocation indirectly. Retail brokerage partnerships for IPO share access are often negotiated through relationships with the lead-left and co-lead banks, meaning which banks lead the deal can shape (modestly) which retail platforms get any allocation at all.
- It affects after-market behavior. The lead-left bank’s stabilization activity in the days following listing can meaningfully dampen (or fail to dampen) early volatility — worth watching closely if you plan to trade in the first week after listing rather than the IPO itself.
FAQ
What does “lead-left” mean in an IPO?
It refers to the underwriting bank listed first — traditionally on the left side — of an IPO prospectus cover page, signifying the bank with primary responsibility for pricing, bookbuilding, and after-market stabilization.
Is Morgan Stanley confirmed as Anthropic’s lead-left bank?
Not yet confirmed. Reporting from the Financial Times indicates Morgan Stanley holds the “pole position” for the role, with Goldman Sachs running closely for a top-tier position, but no final syndicate structure has been publicly confirmed by Anthropic.
Do lead-left banks make more money than other underwriters?
Generally yes. The lead-left bank typically receives the largest share of the total underwriting fee pool, reflecting its greater responsibility and risk in the bookbuilding and pricing process.
Does the lead-left bank guarantee a successful IPO?
No. A strong lead-left bank improves the odds of an orderly process and pricing discipline, but cannot guarantee post-listing stock performance, as SpaceX’s own valuation compression after its June 2026 debut illustrates.

So Delicious Dessert Recall: Affected Products, FDA Guidelines, and Consumer Action

Pakistan’s Current Account Deficit Narrows Sharply to $98 Million in August 2026

Japan Eyes 3.5% Defense Spending: What It Means for Bonds, Stocks, and the BOJ

PSX & KSE Forecast 2026: Navigating the Latest IMF Reports & World Bank Metrics

Trump Administration’s Crypto Policy: Deregulation and the Future of Digital Assets

Monetary Policy and the Policy Rate

Gold, Silver & Bitcoin Prices Q4 2026: Wealth Management Strategies

Business Insurance for Digital Exports: Protecting Your Company in the AI Era

Real Estate Crash Predictions 2026: Data-Backed Regional Guide

What is a “Lead-Left” Bank? Unpacking Morgan Stanley’s Role in Anthropic’s Mega-IPO

Is SPY Overvalued in September 2026? Fed Rate Hike Odds & Intrinsic Value

Pakistan’s KSE-100 Nears Record Territory Even as the Trade Gap Persists

US Consumer Sentiment Sinks as Retail Sales Drop

Barclays Q2 2026 Results: Income Beats, Costs Rise 7%

Top 15 Stocks for Investment in 2026 in PSX: Your Complete Guide to Pakistan’s Best Investment Opportunities
Top 15 Stocks for Investment in 2026 in PSX: Your Complete Guide to Pakistan’s Best Investment Opportunities

Debunking IMF Program Myths: Reconfiguring Engagement for True National Ownership in a Volatile World

Top 10 Mutual Fund Managers in Pakistan for Investment in 2026: A Comprehensive Guide for Optimal Returns

China’s 50% Domestic Equipment Rule: The Semiconductor Mandate Reshaping Global Tech

What the U.S. Attack on Venezuela Could Mean for Oil and Canadian Crude Exports: The Economic Impact

15 Most Lucrative Sectors for Investment in Pakistan: A 2025 Data-Driven Analysis

Pakistan’s Export Goldmine: 10 Game-Changing Markets Where Pakistani Businesses Are Winning Big in 2025
15 Most Lucrative Sectors for Investment in Pakistan: A 2025 Data-Driven Analysis
15 Most Lucrative Sectors for Investment in Pakistan: A 2025 Data-Driven Analysis

Pakistan’s Stock Market Renaissance: How 2025’s Hottest Investment Opportunity Is Democratizing Wealth—A Complete Beginner’s Guide

Pakistan’s Economic Outlook 2025: Between Stabilization and the Shadow of Stagnation
Pakistan’s Economic Outlook 2025: Between Stabilization and the Shadow of Stagnation

China’s Property Woes Could Last Until 2030—Despite Beijing’s Best Censorship Efforts
-
 Markets & Finance9 months ago
Top 15 Stocks for Investment in 2026 in PSX: Your Complete Guide to Pakistan’s Best Investment Opportunities
-
Markets & Finance9 months ago
Top 15 Stocks for Investment in 2026 in PSX: Your Complete Guide to Pakistan’s Best Investment Opportunities
-
 Analysis8 months ago
Debunking IMF Program Myths: Reconfiguring Engagement for True National Ownership in a Volatile World
-
 Investment8 months ago
Top 10 Mutual Fund Managers in Pakistan for Investment in 2026: A Comprehensive Guide for Optimal Returns
-
 Asia9 months ago
China’s 50% Domestic Equipment Rule: The Semiconductor Mandate Reshaping Global Tech
-
 Global Economy9 months ago
What the U.S. Attack on Venezuela Could Mean for Oil and Canadian Crude Exports: The Economic Impact
-
 AI9 months ago
15 Most Lucrative Sectors for Investment in Pakistan: A 2025 Data-Driven Analysis
-
 Exports9 months ago
Pakistan’s Export Goldmine: 10 Game-Changing Markets Where Pakistani Businesses Are Winning Big in 2025