
Economy & Markets
Pakistan’s KSE-100 Nears Record Territory Even as the Trade Gap Persists

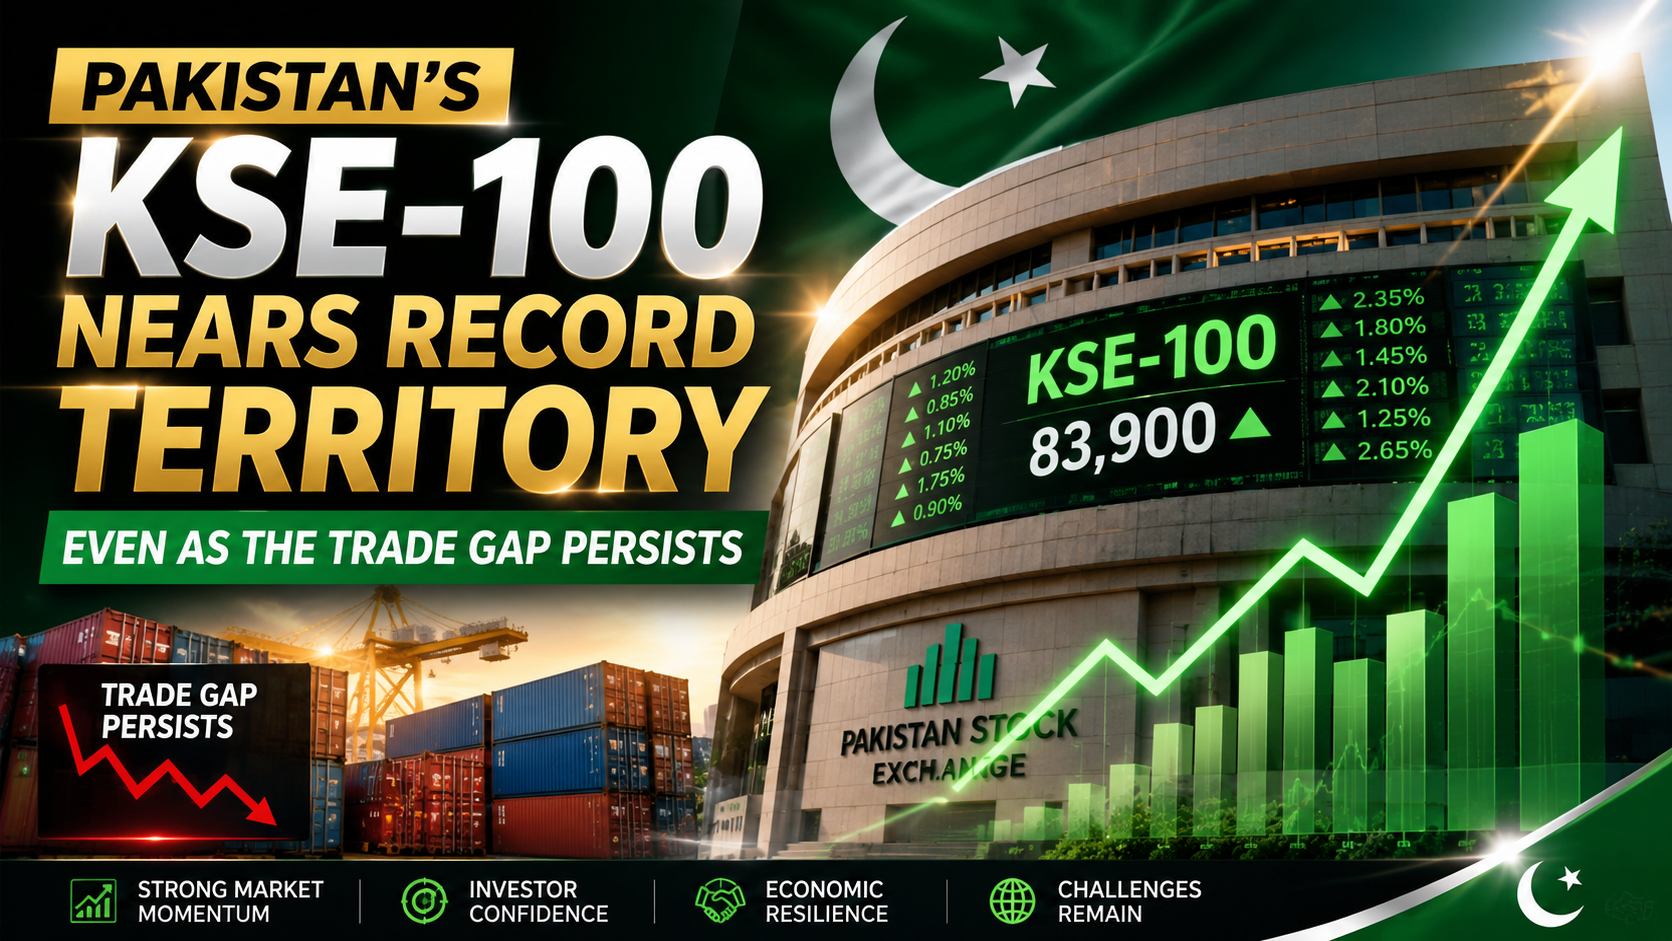
Pakistan’s KSE-100 is up nearly 19% year-on-year and within striking distance of its all-time high — even as the country’s structural trade deficit remains unresolved. Here’s the full picture.
Pakistan’s stock market is delivering one of the more remarkable emerging-market growth stories of 2026, even as the country’s underlying trade imbalance remains a live structural concern. Per Trading Economics, the KSE-100 fell to 178,213 points on August 18, 2026, losing 1.27% from the previous session — but the index remains up 18.99% compared to the same time last year and has climbed 1.30% over the past month, with the index having touched an all-time high of 189,556 points.
Key Takeaways
- The KSE-100 stood at 178,213 points on August 18, 2026, up 18.99% year-on-year, and within range of its all-time high of 189,556.
- The index has gained 10.89% over the past four weeks and 64.89% over the past twelve months by an alternate measure of the same rally.
- The rally is being driven by macro stabilisation, S&P’s credit upgrade (see Article 4), and renewed foreign portfolio inflows.
- Pakistan’s structural trade gap — imports consistently exceeding exports — remains unresolved even as equities rally.
- Historical precedent (2024’s record run) shows KSE-100 rallies have previously been fuelled by the largest foreign equity buying in a decade.
The scale of the multi-year rally is worth putting in context, because Pakistan’s equity market has been one of the standout performers globally over an extended stretch, not just a recent spike. The Trading Economics data shows the index gained 10.89% over a recent four-week window and 64.89% over the trailing twelve months, reaching successive all-time highs through late 2025 and into 2026 — from 170,249 in mid-December 2025 to 170,719 by year-end to 189,556 at its most recent peak.
This isn’t the first time Pakistan’s market has rallied on this scale, and the historical pattern is instructive. A Bloomberg report from a prior cycle describes the KSE-100 closing near a then-record high after gaining more than 30% in a single year, aided by foreign investors’ net purchases of $87 million in local shares — at the time, the highest level of foreign buying since 2014. The current rally, still building on that earlier momentum, reflects a continuation of the same foreign-inflow-driven dynamic, now reinforced by the macro stabilisation narrative detailed in Article 4: S&P’s July 22 upgrade of Pakistan’s sovereign credit rating to ‘B’ from ‘B-‘, alongside a 22-year-low fiscal deficit of 2.6% of GDP.
What the rally does not resolve, however, is Pakistan’s persistent external trade imbalance — a structural feature the equity euphoria sits somewhat uneasily alongside. Pakistan’s own national statistics, summarized on Wikipedia’s Economy of Pakistan page using official data, show exports of $40.79 billion against imports of $78.02 billion in 2025 — a nearly $37 billion gap, with petroleum imports alone totaling $15.1 billion, textiles remaining the dominant export category at $16.3 billion, and China, the UAE and the US as the country’s largest trading partners on both sides of the ledger.
Business press coverage from Business Recorder captures the tension in real time: alongside reporting on the fiscal deficit improvement and credit upgrade, the same outlet has separately reported on Pakistan’s textile mills being “caught in a contradiction they did not design” regarding their European buyers, and on the Finance Division sounding “the alarm over the persistent inflation” even as headline stabilisation indicators improve — evidence that the equity rally and the export-competitiveness challenge are running on genuinely separate tracks, both real, both simultaneously true.
Why It Matters
A market this close to record highs, riding genuine macro-improvement momentum, sends a strong signal to portfolio investors evaluating frontier and emerging markets broadly — but the persistent trade gap is the metric that ultimately determines how much of that momentum translates into durable currency stability and reduced dependence on IMF and bilateral bridge financing.
Data and Evidence
- KSE-100, August 18, 2026: 178,213 points, -1.27% daily, +18.99% YoY, +1.30% over the past month
- KSE-100 all-time high: 189,556 points
- 2025 exports: $40.79bn; 2025 imports: $78.02bn (petroleum: $15.1bn of the total)
- S&P sovereign rating: upgraded to ‘B’ from ‘B-‘ (July 22, 2026)
- FY2025-26 fiscal deficit: 2.6% of GDP, a 22-year low
Global Impact
Pakistan’s equity rally, set against a still-wide trade deficit, is a data point international frontier-market investors weigh alongside similar stabilisation-but-imbalanced stories in other IMF-program economies — a useful comparative lens for any reader tracking emerging-market risk more broadly across this batch’s coverage of Indonesia (Article 11) and other developing economies.
What Happens Next
Watch whether the KSE-100 tests its 189,556 all-time high in the coming weeks, and whether Pakistan’s upcoming trade data shows any narrowing of the export-import gap as the fiscal stabilisation narrative continues to build.
Frequently Asked Questions
Is the KSE-100 at a record high right now?
Not quite — as of August 18, 2026 it stood at 178,213, below its all-time high of 189,556, though up nearly 19% year-on-year.
What’s driving the rally?
Macro stabilisation, the S&P credit rating upgrade, a record-low fiscal deficit, and renewed foreign portfolio inflows.
Does the stock rally mean Pakistan’s economy has fully recovered?
Not entirely — the country’s structural trade deficit, with imports far exceeding exports, remains unresolved.
How big is Pakistan’s trade gap?
Roughly $37 billion in 2025, with imports of $78.02 billion against exports of $40.79 billion.
Has Pakistan’s market rallied like this before?
Yes — a similar rally in 2024 was driven by the largest foreign equity buying in a decade at that time.


Oil Markets
Strait of Hormuz Crisis: What the Latest Tanker Attacks Mean for Oil, Shipping and Global Trade
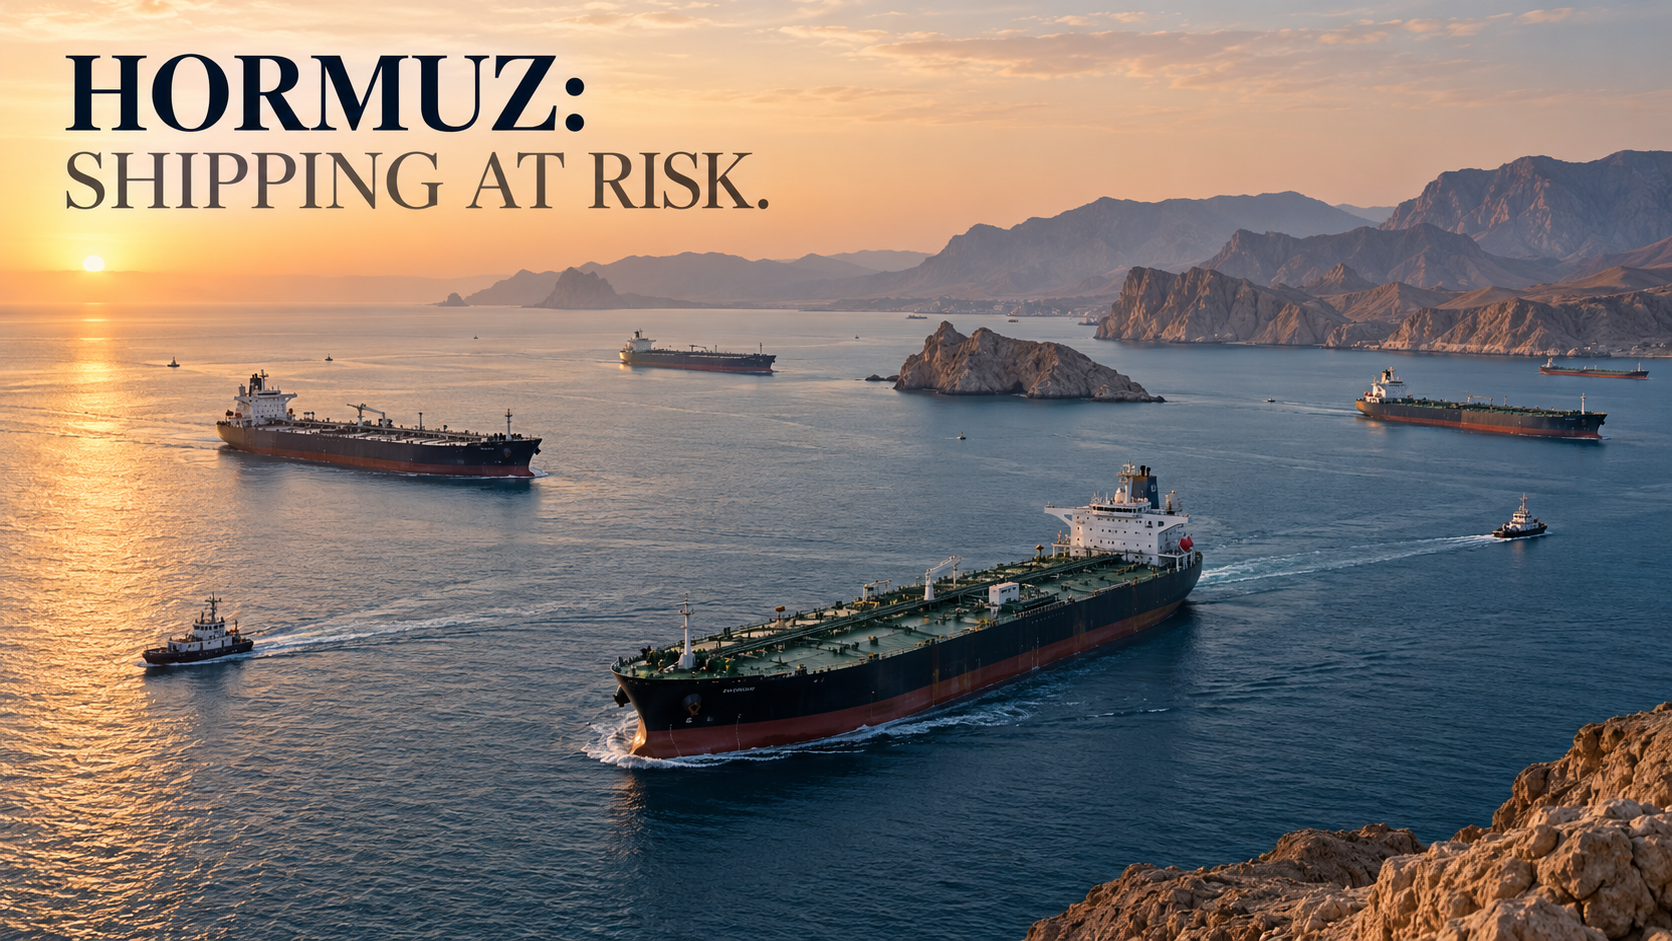
Shipping through the Strait of Hormuz, the narrow passage linking the Persian Gulf with the Gulf of Oman, remains dangerously disrupted after a renewed sequence of attacks on commercial tankers. Data reported by Reuters on October 8 showed commodity-vessel transits falling to their lowest point in more than two months, even as portions of the oil-export system had adapted to months of conflict. The immediate implications extend beyond crude prices: shipping insurance, the security of crews, refined fuels and supply chains all face pressure. Reuters’ October 8 shipping report and Lloyd’s List Intelligence’s maritime assessment provide a grounded view of the disruption.
Key takeaways:
- The strait remains severely restricted for many commercial operators, but “zero shipping” would be inaccurate.
- Recent attacks have increased risk even as some exporters have developed costly workarounds.
- Vessel transits, crude shipments and refined-product deliveries are different measures; they can move in different directions.
- Shipping conditions depend on security, insurance, crew availability, terminals, vessels and routes—not just whether the waterway is physically navigable.
Is the Strait of Hormuz closed?
There is no simple yes-or-no answer. The passage is geographically open water, but military threats and commercial risk have sharply curtailed ordinary shipping. Some vessels continue to transit while others hold back, reroute or operate under exceptional arrangements. A headline declaring a complete physical closure would erase these distinctions.
In the period reviewed by Reuters, Kpler data indicated just seven commodity-vessel passages on Tuesday, October 6, followed by 10 on Wednesday, October 7. Other tracking sources used different vessel definitions and recorded slightly different counts. These figures are snapshots, not an unchanging daily average and not proof that every class of cargo stopped moving.
The conflict’s maritime effects have continued through successive phases in 2026. An earlier understanding enabled some recovery, but the latest attacks illustrate how quickly owners, insurers and captains can reassess risk.
Why Hormuz matters to the global economy
The strait is among the most consequential energy chokepoints because Gulf producers rely on it to reach buyers in Asia and elsewhere. Tanker movements affect crude oil, condensate and petroleum products; liquefied natural gas ships also use the route.
For a sense of scale, the U.S. Energy Information Administration’s 2026 chokepoint analysis estimates average oil flows through Hormuz at 21.6 million barrels per day in the fourth quarter of 2025, compared with 4.9 million barrels per day in the second quarter of 2026. These are quarterly flow estimates, not real-time October readings. They show how significant the early disruption became, but they should not be conflated with current daily transits.
| Metric | Reported observation | What it actually measures |
|---|---|---|
| Hormuz oil flows, Q4 2025 | 21.6 million barrels/day | Quarterly average of crude, condensate and products; EIA |
| Hormuz oil flows, Q2 2026 | 4.9 million barrels/day | Quarterly average following conflict disruption; EIA |
| Commodity vessels, October 6 | 7 passages | Particular-day Kpler vessel observation reported by Reuters |
| Commodity vessels, October 7 | 10 passages | Next-day snapshot, not oil volume |
This illustrates a common mistake in rapidly moving market coverage: a lower ship count does not mechanically mean oil volume declines by the same percentage. Tanker size, load levels, cargo type and alternative export routes matter.
The latest attacks and security assessment
In its October 8 report, Lloyd’s List Intelligence said at least 13 attacks on tankers or gas carriers had been recorded since September 28. The specialist service characterized commercial shipping threats as severe and described continued pressure on the export-recovery network.
The crisis is about the safety of maritime crews as much as it is about the price of oil. A vessel that can technically sail may still lack affordable insurance, an acceptable charter agreement or crew willingness to enter a high-threat area. Owners must consider security advisories, flag and sanctions exposure, the destination of the cargo and possible interruptions on the return voyage.
Financial Times reporting has described attacks extending beyond the narrow waterway, underscoring that an operator’s exposure can continue across surrounding Gulf shipping routes. This is why changing the transit route within a region does not automatically remove the risk.
Why oil flows can recover while shipping stays abnormal
Export systems adapt when normal logistics break down. Cargo can be moved overland where pipelines exist, loaded through alternative ports, consolidated into larger vessels, or transferred between ships. These arrangements can restore some export volumes without recreating pre-crisis shipping conditions.
Lloyd’s List reported 477 non-Iranian-linked transits during September 2026, its highest month since the conflict began, while also noting that workarounds remained costly and concentrated among a relatively small group of operators. That September total and the October daily count are not directly comparable: one is a full-month measure with a specific ship definition, the others are daily snapshots of commodity vessels.
A recovered barrel is not necessarily a recovered route. It may reach its buyer after longer sailing time, additional handling, higher freight charges and elevated security costs. That extra complexity is economically important even if headline export tonnage appears healthier.
Insurance as a second chokepoint
War-risk coverage is a critical commercial constraint. Insurers assess the likelihood of a vessel being damaged, detained or unable to complete its voyage. Owners and charterers must decide whether premiums and contract terms are acceptable. A large increase in required coverage can deter normal cargo movements even where navigation remains physically possible.
Changing conditions also complicate freight pricing. Tanker availability may be constrained if vessels are stuck, diverted or committed to long journeys. Higher tanker day rates and delays can feed into delivered energy costs independent of the benchmark price of crude.
Implications for oil prices, diesel and LNG
Crude oil prices reflect both immediate supply and expectations about future supply. A security incident can raise risk premiums before cargo volumes fall. Conversely, an announcement suggesting lower tension can reduce futures prices without instantly reopening commercial routes.
Refined petroleum products are a separate problem. Gasoline, diesel and jet fuel depend on refinery operations, product-specific export terminals, storage and specialized trading networks. Even when crude output rebounds, damaged or curtailed refinery operations can keep particular fuels scarce. The EIA’s July 2026 analysis described how Middle East disruptions changed petroleum-product sourcing and strengthened refining margins in some other markets.
LNG adds another layer. Gas shipments operate with their own contracts, terminal capacity and vessel availability. An oil-volume recovery does not necessarily describe the state of gas markets.
What should businesses watch next?
Instead of relying on a single dramatic headline, an energy buyer or logistics manager should monitor the following signals together:
- Security incidents: independently confirmed vessel strikes and official maritime risk notices.
- Physical passages: comparable daily and weekly vessel counts using consistent definitions.
- Commodity throughput: crude, refined products and gas separately, not one blended total.
- Freight and insurance: costs of obtaining transportation and coverage for the route.
- Alternative routes: operational pipeline and port capacity, not merely theoretical map distances.
- Refinery status: the availability of usable finished fuels, especially diesel and jet fuel.
Political announcements also matter, but market conditions are shaped by whether ships actually sail and cargo reaches buyers.
Frequently asked questions
Where is the Strait of Hormuz?
It lies between Iran to the north and Oman and the United Arab Emirates region to the south, linking the Persian Gulf with the Gulf of Oman and the Arabian Sea.
Is any shipping still getting through?
Yes. Reuters and Lloyd’s List reported continued, restricted vessel traffic during October 2026. A full shutdown of every vessel would misrepresent these observations.
Why are ship counts and barrels per day different?
Ships vary in size, type and how fully they are loaded. Some vessels transport crude, others products or gas. A transit count and an oil-volume estimate answer different questions.
Does a rise in crude exports mean the crisis is over?
No. Alternative routing, increased insurance costs and attacks can persist even when headline crude export volumes improve.
Which countries face the greatest exposure?
Gulf producers and energy-importing economies are directly exposed, but freight costs, energy prices and financial-market volatility can transmit effects globally.
What should readers trust when forecasts conflict?
Prefer clearly dated EIA data, Reuters reporting and specialist Lloyd’s List methodology. Check both the underlying date and the definition of a transit.
Bottom line
Hormuz is not just a map location. It is a chain of commercial decisions shaped by security, insurance, shipping capacity and energy infrastructure. The October attacks demonstrate how an apparent recovery in some cargo flows can coexist with an intensely risky transportation environment. The most useful reporting separates what has been verified today from historical context and what could happen next.

Is the global housing market slowing down in 2026? Broadly, yes — Fitch Ratings’ mid-year 2026 Global Housing and Mortgage Outlook forecasts weaker housing market conditions across most major markets this year, as inflation pushes mortgage rates higher, erodes affordability, and softening labor markets add pressure on borrowers, according to Fitch’s own analysis republished by Hellenic Shipping News. But that headline slowdown masks sharp regional divergence — several markets are still seeing genuinely strong price growth, even as others stagnate or face rising mortgage arrears.
The single biggest disruptor cited across nearly every major 2026 housing forecast is the same one reshaping oil, gold, and central-bank policy this year: the Iran conflict. Fitch specifically notes that Iran-conflict-driven oil prices have raised inflation and mortgage rates, pressuring building costs and new housing supply, and dampening market activity broadly through the remainder of 2026.
Where Home Prices Are Actually Falling Behind
Featured Snippet Target: Fitch Ratings has raised its mortgage-arrears and mortgage-rate forecasts while lowering its home-price forecasts specifically for the UK and Australia in 2026 and 2027, citing rising gilt yields and political risk pushing UK mortgage rates higher, and stretched affordability combined with a higher-for-longer interest rate environment weighing on Australian market activity.
Canada presents a related but distinct concern: Fitch has increased its mortgage arrears forecast for the country specifically because borrower pressure is mounting — personal bankruptcies have reached their highest level since 2009, unemployment has ticked up, home equity has declined alongside lower prices, and a wave of mortgages are resetting at materially higher rates as fixed terms from the ultra-low-rate era expire. Despite that stress, Royal LePage’s own 2026 forecast still projects Canada’s national aggregate home price rising a modest 1% year-over-year to $823,016 by the fourth quarter of 2026, framing the market as being in a “reset” phase following the trade-war and political-leadership-driven uncertainty of 2025, according to Castanet Kamloops.
The U.S. and France are both expected to see outright price stagnation in 2026 in Fitch’s forecast, with policy uncertainty affecting consumer sentiment and home-purchase decisions in both markets — though Fitch notes any U.S. price declines are expected to bottom out within 2026 rather than continuing into 2027, while France may see actual price falls extend into next year, according to Fitch’s annual outlook as reported by the Mortgage Bankers Association’s newslink service.
Where Home Prices Are Still Climbing Fastest
The strongest 2026 home-price gains globally are concentrated in a specific set of markets with structural supply constraints. Fitch expects Spain to lead with 8-10% price growth, driven by robust demand from immigration and non-resident buyers, followed by Mexico at 7-8% and Brazil at 5-7%. Fitch describes supply constraints across these and other markets — including Canada, Germany, and the Netherlands — as “entrenched,” driven by persistently high land, labor, and material costs, with lengthy permitting and regulatory processes compounding the shortage. Policy efforts in Spain and Mexico specifically aimed at boosting new housing supply are likely to only modestly help, according to Fitch, and are unlikely to close existing supply gaps in the near term.
Australia occupies a distinctive middle position: while Fitch has lowered its overall home-price forecast for the country due to affordability pressures, separate industry forecasts remain notably more bullish. Domain’s 2026 forecast projects record prices across every major Australian capital city, with the combined median house value rising 6% to a new high of $1,339,267, and Sydney specifically forecast to see house prices climb 7% to a record median of $1,924,430, according to Money Magazine’s coverage of the report. Domain’s chief of research and economics, Nicola Powell, has attributed this continued strength to sustained high demand meeting buyers “continuing to chase affordability” — particularly in the unit market, where several cities are forecast to outperform house-price growth. Australia’s approvals process remains below the level needed to meet household-formation needs, driven by strong migration and historically low average household sizes, keeping vacancies tight and prices supported even as affordability pressures mount.
The UK’s More Modest, But Still Positive, Outlook
The UK sits between these extremes. While Fitch has turned more cautious on UK housing specifically, individual UK lenders and portals have published more modestly positive 2026 forecasts: Halifax expects prices to rise 1-3% this year in what it calls a “steady rather than spectacular” market, Nationwide forecasts 2-4% growth citing improving affordability, and Savills expects around 2% growth in 2026 with nearly 25% cumulative growth by 2030, according to Morningstar’s compilation of lender forecasts. Rightmove’s early-2026 data showed a 2.8% jump in January asking prices — the largest increase for that month on record — suggesting genuine early-year buyer momentum even as Fitch’s more cautious full-year framing points to headwinds building from rising gilt yields and a softening labor market.
The Common Thread Across Every Market
Reading across all these national forecasts, a consistent pattern emerges: markets with genuine, structural housing shortages (Spain, Mexico, Brazil, Australia) are seeing prices climb despite the same higher-mortgage-rate, inflation-driven headwinds affecting every other market, while markets without acute supply constraints or facing specific domestic stress factors (the UK’s fiscal and political risk, Canada’s borrower distress, the US’s policy uncertainty) are seeing stagnation or increased arrears risk. Interest rates and inflation are a genuinely global headwind in 2026, but local supply-demand fundamentals — not the global rate environment — appear to be what’s actually determining which markets are outperforming.
The Bottom Line
The global housing market in 2026 isn’t experiencing a uniform slowdown or a uniform boom — it’s fracturing along supply-constraint lines. Spain, Mexico, Brazil, and Australia’s supply-starved capital cities are still posting genuinely strong price growth even amid rising global mortgage rates, while the UK, Canada, the US, and France are seeing varying degrees of stagnation or rising borrower stress, driven by a mix of domestic political risk, borrower distress, and policy uncertainty layered on top of the shared global backdrop of Iran-conflict-driven inflation and elevated mortgage rates.
Next step: Anyone evaluating international real estate exposure in 2026 should weight local supply-constraint data more heavily than headline national interest-rate trends — the countries outperforming this year are doing so specifically because structural undersupply is offsetting the same higher-rate pressure that’s weighing on less supply-constrained markets.

Pakistan’s equity market has delivered one of the most extraordinary runs in global finance — and then, quietly, stopped.
The KSE-100 reached an all-time high of 189,556 index points earlier in 2026. By mid-September it was trading around 170,000, with a year-to-date change of –1.82% against a 52-week range of 144,119 to 191,033.
That gap between the headline narrative and the current tape is the story most coverage misses.
Key Takeaways
- Where it stands: the KSE-100 closed 18 September 2026 in the 169,000–171,000 band, roughly 11% below its record.
- The three-year run is real: 335% in rupee terms over FY24–FY26, or 347% in dollar terms.
- Foreigners are selling. Net foreign outflows of nearly $900 million during a rally this strong is a warning sign, not a footnote.
- Concentration is the structural risk. A handful of banks and energy names drive most index movement.
- Forecasts are wide: brokerage December 2026 targets range from roughly 203,000 to 263,800.
How the KSE-100 Got Here
The index was launched in November 1991 with a base of 1,000 points. It first crossed 15,000 in April 2008 — meaning the move from there to 189,000 represents more than a twelvefold nominal gain, though rupee depreciation absorbs a large share of that.
The recent leg is more instructive. The KSE-100 gained roughly 44% in rupee terms in fiscal year 2026, outperforming nearly every major asset class for a third consecutive year. Analysts attribute the run to macroeconomic stabilisation under Pakistan’s IMF programme, policy continuity, and the country’s return to international debt markets.
The 2026 Round Trip
The year has not been a straight line:
| Period | KSE-100 Level | Driver |
|---|---|---|
| January 2026 | Intraday high near 189,167 | Peak momentum, domestic institutional inflows |
| March 2026 | Correction to 146,480 | Iran–US/Israel conflict, oil price spike |
| Mid-2026 | Recovery above 180,000 | Conflict de-escalation, energy prices easing |
| Mid-September 2026 | 169,000–171,000 | Consolidation, foreign selling |
The March drawdown — roughly 22% peak to trough — is the single most useful data point for anyone sizing a Pakistan position. It shows exactly how the index behaves when oil moves against an import-dependent economy.
Reading the Daily Tape
Recent sessions show a market with domestic bid support but no conviction breakout. On 17 September the KSE-100 closed at 169,043, up 1,021 points, with volume around 125 million shares and traded value of Rs13.45 billion. Exploration and production stocks contributed the most (339 points), followed by commercial banks (304) and cement (149).
Two days earlier the index surged 1,421.67 points to 169,392, taking total market capitalisation to Rs18.857 trillion.
That sector mix — E&P, banks, cement — is the KSE-100. If you have a view on Pakistani equities, you have a view on oil, interest rates and construction activity. Everything else is noise around the edges.
The Three Risks Nobody Puts in the Headline
1. Foreign Investors Are Not Convinced
Nearly $900 million of net foreign selling during a rally of this magnitude suggests international institutions view the move as domestically funded and potentially fragile. Domestic mutual funds and insurance companies have been the marginal buyer.
This matters because foreign flows historically set the ceiling in frontier markets. A rally without them can continue — but it tends to reverse faster.
2. Concentration Risk
A small group of heavyweights — UBL, OGDC, Engro, HBL, Lucky Cement and Bank Alfalah — has driven a disproportionate share of index gains. United Bank Limited overtook Oil & Gas Development Company as Pakistan’s largest listed company by market capitalisation in early 2026.
An index-tracking position in Pakistan is effectively a leveraged bet on domestic banking margins.
3. Geopolitical and Commodity Sensitivity
Pakistan imports the majority of its energy. The World Bank’s June 2026 Global Economic Prospects flags exactly this transmission channel, noting that emerging market and developing economies dependent on energy imports face the weakest per capita income growth since the pandemic.
The March correction was that risk crystallising in real time.
Valuation and the 2027 Question
Brokerage targets for December 2026 diverge sharply: roughly 203,000 from Topline against 263,800 from AKD Research. The bullish case, if realised, would push PSX market capitalisation past $100 billion for the first time.
That spread — about 30% between two credible houses — tells you the market’s direction is genuinely contested, not consensus.
| Scenario | Index Path | Requires |
|---|---|---|
| Base | 190,000–205,000 by year-end | Policy rate cuts, stable currency, IMF review passed |
| Bull | 240,000+ | Foreign inflows return, oil below $80, earnings upgrades |
| Bear | Retest of 150,000 | Energy shock, IMF programme friction, political disruption |
How to Invest in Pakistani Stocks
For domestic investors:
- Open a CDC sub-account through a PSX-licensed broker; check the Pakistan Stock Exchange broker directory.
- Decide between index exposure and stock selection. Given concentration, an index position is not as diversified as it appears.
- Match sector exposure to your macro view. Banks benefit from high rates; cement and autos benefit from cuts. They cannot both work.
- Track the IMF review calendar. Programme milestones have moved this market more reliably than earnings.
For foreign investors, the practical constraints are repatriation mechanics, custody arrangements and liquidity. Daily traded value of roughly Rs13–17 billion (approximately $45–60 million) means institutional-size positions take days to build and longer to exit.
What This Means for the Global Market in 2027
Frontier markets are being repriced on macro discipline, not growth. Pakistan’s re-rating tracked IMF compliance and external account stabilisation more closely than it tracked corporate earnings. That template now applies across frontier Asia.
Foreign flows are the missing catalyst. The single variable most likely to determine whether 2027 delivers 203,000 or 263,800 is whether international institutions reverse their selling.
Oil remains the dominant external variable. With the IMF projecting global growth of 3.0% in 2026 and 3.4% in 2027 under conditions where energy importers bear the heaviest burden, Pakistan’s index is effectively short crude.
Index upgrades are the structural prize. Any move toward emerging-market classification would force passive allocation into a market that currently receives almost none.
Currency is the hidden return driver. Dollar-denominated returns exceeded rupee returns in FY26 — an unusual and unsustainable configuration that foreign investors should not extrapolate.
Frequently Asked Questions
What is the KSE-100 index today?
The KSE-100 traded between 169,400 and 171,037 on 18 September 2026, with a previous close of 169,043. Its 52-week range is 144,119 to 191,033.
Is the Pakistan Stock Exchange a good investment in 2026?
It delivered roughly 44% in rupee terms in FY26 but is slightly negative year-to-date in calendar 2026. Returns depend heavily on oil prices, policy rates and IMF programme continuity.
Why are foreign investors selling Pakistani stocks?
Net foreign outflows approached $900 million during the recent rally, suggesting international institutions are unconvinced the domestically funded move is durable.
What is the KSE-100 forecast for December 2026?
Brokerage targets range from about 203,000 (Topline) to 263,800 (AKD Research). The wide spread reflects genuine disagreement on foreign flows and energy prices.

Pakistan Freelancers Tax 2026: Payments, Documentation and Formal Growth

Strait of Hormuz Crisis: What the Latest Tanker Attacks Mean for Oil, Shipping and Global Trade

AI Customer Service in 2026: What’s Working, What’s Failing, and What to Buy

Open a Savings Account Online: How to Actually Earn 10x the National Average Rate

Global Housing Market 2026: Where Prices Rise, Where They Don’t

PSX and KSE-100 Record Highs: An Insider’s Guide to Pakistan Stocks

So Delicious Dessert Recall: Affected Products, FDA Guidelines, and Consumer Action

Pakistan’s Current Account Deficit Narrows Sharply to $98 Million in August 2026

Japan Eyes 3.5% Defense Spending: What It Means for Bonds, Stocks, and the BOJ

PSX & KSE Forecast 2026: Navigating the Latest IMF Reports & World Bank Metrics

Trump Administration’s Crypto Policy: Deregulation and the Future of Digital Assets

Monetary Policy and the Policy Rate

Gold, Silver & Bitcoin Prices Q4 2026: Wealth Management Strategies

Business Insurance for Digital Exports: Protecting Your Company in the AI Era

Top 15 Stocks for Investment in 2026 in PSX: Your Complete Guide to Pakistan’s Best Investment Opportunities
Top 15 Stocks for Investment in 2026 in PSX: Your Complete Guide to Pakistan’s Best Investment Opportunities

Debunking IMF Program Myths: Reconfiguring Engagement for True National Ownership in a Volatile World

Top 10 Mutual Fund Managers in Pakistan for Investment in 2026: A Comprehensive Guide for Optimal Returns

China’s 50% Domestic Equipment Rule: The Semiconductor Mandate Reshaping Global Tech

What the U.S. Attack on Venezuela Could Mean for Oil and Canadian Crude Exports: The Economic Impact

15 Most Lucrative Sectors for Investment in Pakistan: A 2025 Data-Driven Analysis

Pakistan’s Export Goldmine: 10 Game-Changing Markets Where Pakistani Businesses Are Winning Big in 2025
15 Most Lucrative Sectors for Investment in Pakistan: A 2025 Data-Driven Analysis

Pakistan’s Stock Market Renaissance: How 2025’s Hottest Investment Opportunity Is Democratizing Wealth—A Complete Beginner’s Guide
15 Most Lucrative Sectors for Investment in Pakistan: A 2025 Data-Driven Analysis

How to Become an Active Taxpayer on Pakistan’s FBR Active Taxpayer List (ATL) in 2026: A Step-by-Step Guide

Pakistan’s Economic Outlook 2025: Between Stabilization and the Shadow of Stagnation

Best Investments in Pakistan 2026: Top 10 Low-Price Shares and Long-Term Picks for the PSX
-
 Markets & Finance10 months ago
Top 15 Stocks for Investment in 2026 in PSX: Your Complete Guide to Pakistan’s Best Investment Opportunities
-
Markets & Finance10 months ago
Top 15 Stocks for Investment in 2026 in PSX: Your Complete Guide to Pakistan’s Best Investment Opportunities
-
 Analysis9 months ago
Debunking IMF Program Myths: Reconfiguring Engagement for True National Ownership in a Volatile World
-
 Investment9 months ago
Top 10 Mutual Fund Managers in Pakistan for Investment in 2026: A Comprehensive Guide for Optimal Returns
-
 Asia10 months ago
China’s 50% Domestic Equipment Rule: The Semiconductor Mandate Reshaping Global Tech
-
 Global Economy10 months ago
What the U.S. Attack on Venezuela Could Mean for Oil and Canadian Crude Exports: The Economic Impact
-
 AI10 months ago
15 Most Lucrative Sectors for Investment in Pakistan: A 2025 Data-Driven Analysis
-
 Exports10 months ago
Pakistan’s Export Goldmine: 10 Game-Changing Markets Where Pakistani Businesses Are Winning Big in 2025