
Analysis
Section 301 Forced Labor Tariffs 2026: 60 Countries Affected

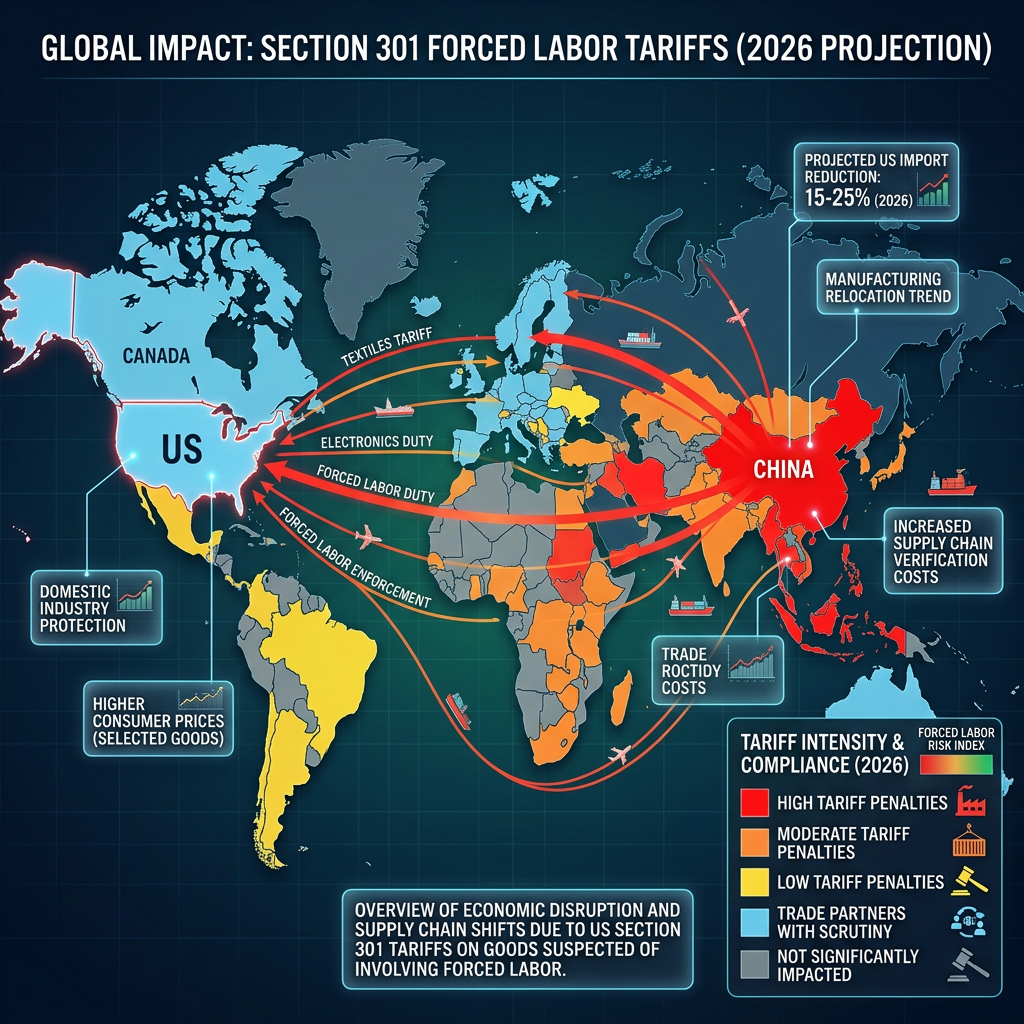
On June 2, 2026, the Office of the United States Trade Representative made a determination that quietly touches nearly every major global trading relationship at once: all 60 economies investigated for failing to adequately prohibit or enforce bans on forced-labor-produced imports were found to be acting unreasonably and burdening US commerce — with proposed tariffs of 10% to 12.5% now on the table for each (USTR).
This isn’t a fringe trade action. The 60 economies under investigation account for over 90% of all imports into the United States (Covington & Burling) — meaning this single proceeding has the potential to reshape tariff exposure across nearly the entire US import base simultaneously.
Why the Legal Framing Matters More Than the Headline
Understanding why USTR chose this specific legal pathway is essential context most coverage skips. Following a Supreme Court ruling that President Trump lacked authority to impose broad tariffs under the International Emergency Economic Powers Act (IEEPA), the administration pivoted to Section 301 of the Trade Act of 1974 — a statutory authority Congress has explicitly delegated to the executive branch for addressing unreasonable or discriminatory foreign trade practices, offering a legally sturdier foundation for longer-term tariffs than the IEEPA route that courts struck down (Covington & Burling).
That legal pivot is the real story: it signals the administration intends to build a more durable, litigation-resistant tariff architecture going forward, rather than relying on emergency powers that face ongoing court challenges.
The Two-Tier Structure, and Who Lands Where
USTR’s proposed action splits the 60 economies into two tariff tiers based on their existing forced-labor enforcement posture. Fourteen unique trading entities — including 13 countries plus the European Union — qualify for the lower 10% rate because they either maintain some form of import prohibition, operate a partial enforcement regime, or have committed to action through an Agreement on Reciprocal Trade (Green Worldwide Shipping).
The remaining 46 economies, which have neither imposed a forced labor import prohibition nor committed to establishing one, face the higher 12.5% rate.
Within the lower tier, USTR specifically identified six economies — Canada, Ecuador, the European Union, Indonesia, Mexico, and Pakistan — as jurisdictions that do maintain a forced labor import prohibition on paper, but have failed to enforce it effectively (Green Worldwide Shipping). That’s a notably diverse list spanning North America, South America, Europe, and South and Southeast Asia — underscoring that this is a genuinely global enforcement action, not one targeted at a specific region or bloc.
What USTR’s Own Report Argues Is at Stake
USTR’s underlying findings frame the economic argument in fairly direct terms: the failure to impose and enforce forced labor import prohibitions undermines global efforts to eliminate forced labor, permits firms using forced labor to produce goods at artificially lower cost, and correspondingly reduces the profitability and competitiveness of firms that don’t rely on forced labor (Green Worldwide Shipping). US Trade Representative Ambassador Jamieson Greer acknowledged some trading partners have taken initial steps — through USMCA commitments and Agreements on Reciprocal Trade — but stated each partner “must do more to ensure that trade does not perversely encourage and entrench forced labor globally” (Thompson Hine SmarTrade).
The Exemptions That Actually Determine Real-World Impact
The headline 10-12.5% figures overstate the action’s uniform impact, because the proposal includes a substantial list of carve-outs that materially change exposure depending on product category and origin. Goods listed in Annex A of the Federal Register notice — organized by Harmonized Tariff Schedule classification rather than product name — are excluded entirely. Also excluded: products already subject to Section 232 sector-specific duties, USMCA-compliant goods from Canada and Mexico, textiles and apparel entering duty-free under CAFTA-DR from Costa Rica, the Dominican Republic, El Salvador, Guatemala, Honduras, or Nicaragua, and informational materials, donations, and accompanied baggage (Covington & Burling).
USTR has also proposed a specific textile mechanism allowing a certain volume of apparel and textile imports to enter at the reduced Section 301 rate, calibrated to the volume of US-manufactured textile inputs (cotton and man-made fibers) that a given trading partner imports from the United States — effectively rewarding countries that maintain reciprocal textile trade relationships with the US (Clark Hill).
The Process Timeline and Why It Matters for Businesses Now
USTR initiated these 60 investigations on March 12, 2026, and moved through the process on what the agency has explicitly called an “accelerated timeframe.” Over the following weeks, USTR held consultations with 46 of the 60 targeted governments, received more than 450 public comments, and conducted two days of public hearings on April 28-29, 2026, with nearly 60 witnesses testifying (Green Worldwide Shipping).
The next critical dates: written public comments on the proposed actions were due July 6, 2026, and the Section 301 Committee held public hearings on the proposed action on July 7, 2026, at the US International Trade Commission in Washington (USTR). Notably, unlike prior Section 301 proceedings, USTR has not indicated it will accept post-hearing rebuttal comments in this instance — suggesting the agency intends to move toward a final determination relatively quickly once the hearing process concludes (Covington & Burling).
Crucially, no new duties are in effect yet — this remains a proposed action pending finalization. But trade law specialists are explicitly advising importers not to wait for finalization before assessing exposure, given how compressed this timeline already is compared to typical Section 301 proceedings (Clark Hill).
What Businesses Should Actually Be Doing Right Now
Trade counsel tracking this proceeding recommend a specific sequence of practical steps for import-exposed businesses. First, map exposure by country of origin and Harmonized Tariff Schedule (HTS) number specifically, pulling 2025-2026 entry data across the 60 investigated economies to identify which product lines would fall outside Annex A or other exclusions. Second, model the proposed 10% and 12.5% duties as an additional tariff layer and stress-test margin impact, pricing strategy, customer cost pass-through capacity, and import bond sufficiency. Third, don’t assume coverage or exemption without verification — confirm Section 232, USMCA, CAFTA-DR, Chapter 98, informational-materials, donation, and Annex A treatment against actual customs documentation rather than general product category assumptions (Clark Hill).
For companies with meaningful exposure, engaging directly in the comment process — either individually or through industry coalitions — remains a live opportunity to influence the final scope, exclusion list, and duty levels before USTR issues its final action.
Why This Story Deserves More Attention Than It’s Getting
Given that this single proceeding touches over 90% of US import volume, spans every major economic region this publication covers — the EU (and by extension UK-adjacent trade dynamics), Canada, Indonesia, and Pakistan are all explicitly named among the six enforcement-gap economies — and represents a structurally more durable tariff mechanism than the IEEPA approach the Supreme Court struck down, it’s genuinely surprising how little mainstream financial coverage has connected these dots into a single comprehensive picture. Most coverage to date has come from specialized trade law and customs compliance publications rather than general business media, leaving a meaningful gap for anyone trying to understand how this action might reshape global trade costs through the second half of 2026 and beyond.
The Bottom Line
The Section 301 forced labor tariff proceeding is one of the most consequential and least-covered trade policy developments of 2026, precisely because its framing — human rights enforcement rather than explicit protectionism — makes it politically harder to challenge than a straightforward tariff action, while its legal foundation under Section 301 makes it more durable than the IEEPA-based tariffs courts have already invalidated. With over 90% of US import volume affected and a compressed timeline that skipped the traditional post-hearing rebuttal period, businesses with meaningful cross-border exposure to any of the 60 named economies — which include major US trading partners across virtually every region — have a narrow and rapidly closing window to assess exposure and engage the process before these tariffs move from proposal to finalized policy.


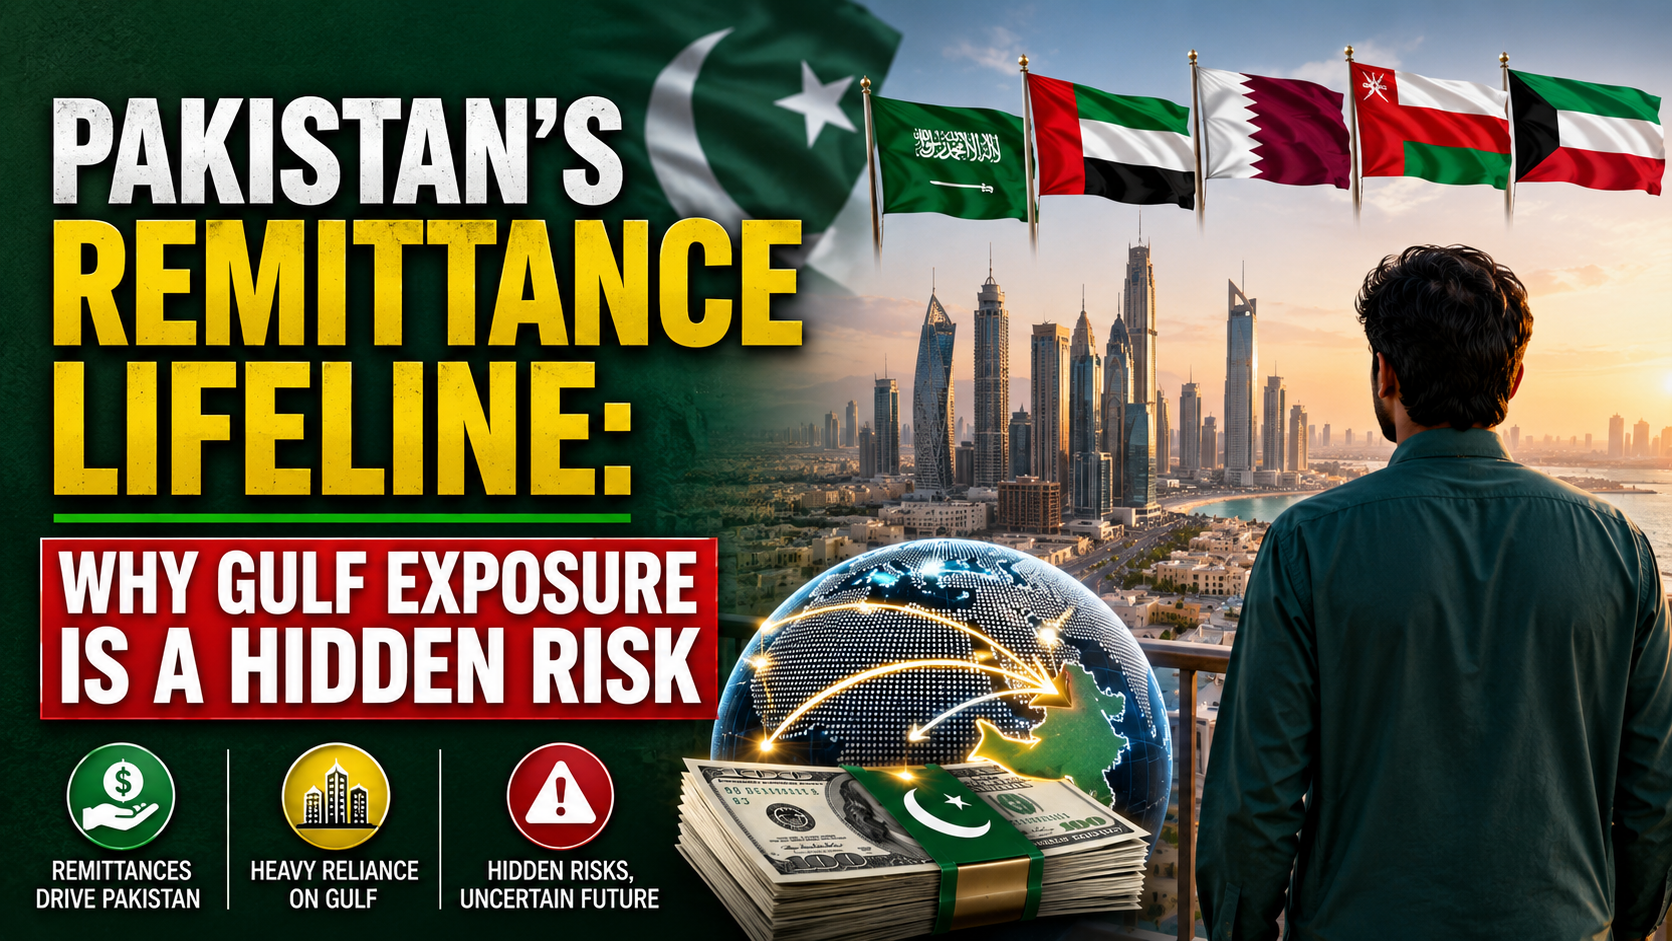
Buried inside the IMF’s latest Pakistan country report is a dependency that receives far less attention than headline GDP or inflation numbers, but arguably carries more immediate risk for millions of households: Pakistan’s economy is structurally exposed to whatever happens next in the Gulf.
The Numbers That Matter
Pakistan receives annual remittances amounting to roughly 9 percent of GDP, of which 55 percent originate from Gulf Cooperation Council countries, according to the IMF’s May 2026 country report. That single funding channel is one of the largest and most stable sources of foreign exchange available to the country — larger, in most years, than export revenue growth or foreign direct investment inflows combined.
The IMF’s own language is unambiguous about the risk this concentration creates: a significant disruption to GCC economies, or a forced return of migrant workers, could weigh heavily on these flows — a major source of financing for both household consumption and Pakistan’s broader balance of payments.
Why This Risk Is Live, Not Theoretical
This is not an abstract stress-test scenario. The Strait of Hormuz disruption, detailed extensively elsewhere in this series, has placed the entire Gulf region’s economic stability under genuine pressure for the first time in years. Should the conflict escalate further or trigger a broader regional economic slowdown, the transmission channel to Pakistan is direct and fast: fewer construction projects and reduced hiring across the GCC translates almost immediately into lower remittance flows from the millions of Pakistani workers employed there.
Capital Flows Are Already Reacting
The IMF has flagged early evidence that this dynamic is not purely hypothetical. Deteriorating global financial conditions have already resulted in capital outflows from Pakistan, which are likely to intensify further if the regional crisis extends, with the Fund specifically noting that access to short-term commercial financing — largely sourced from GCC banks — could also be affected if risk sentiment deteriorates further across the region.
This creates a double exposure that is easy to overlook in headline coverage: Pakistan depends on the Gulf both for the remittance income that supports household consumption, and for the short-term commercial bank financing that helps bridge its external funding gaps between IMF disbursements.
The State Bank’s Reserve Buffer
Pakistan’s own policy response has been to build reserves as a shock absorber. The State Bank of Pakistan has been projecting reserves to continue rising to roughly $18 billion by June 2026 on the back of planned inflows, a level implying that expected capital inflows currently exceed any current account shortfall — but only as long as Pakistan remains within an active IMF programme and maintains access to external funding on favourable terms.
The risk scenario flagged by policy researchers is specific: if monetary easing is mismanaged and confidence in Pakistan’s reform path falters, capital inflows could slow or reverse at the same time imports surge, opening an external funding gap that would draw down reserves and pressure the rupee — a scenario made materially more likely by any Gulf-region shock large enough to simultaneously dent remittances and tighten GCC bank lending.
How much of Pakistan’s remittances come from the Gulf?
Roughly 55% of Pakistan’s remittances — which fund about 9% of GDP — originate from Gulf Cooperation Council countries, making Pakistan’s balance of payments directly exposed to any economic disruption or capital-flow tightening in the Gulf region.
The Agricultural Wildcard
A related, more immediate risk sits in the agricultural supply chain. The IMF notes that disrupted DAP fertiliser supply chains linked to regional tensions could affect the Kharif planting season in June-July, with knock-on effects for food import prices — a second, more direct channel through which Gulf and broader Middle East instability could hit Pakistani households, independent of the remittance and capital-flow risks.
The Policy Takeaway
Pakistan’s economic stabilisation narrative in 2026 — a rebuilding KSE-100, falling inflation, a completed EFF review, covered in depth in our companion article — is real, but it rests on a foundation more exposed to Gulf regional stability than most headline coverage acknowledges. For policymakers in Islamabad, and for the Pakistani diaspora sending capital home each month, the Strait of Hormuz situation is not a distant geopolitical story. It is, in a very direct sense, a domestic economic risk factor.
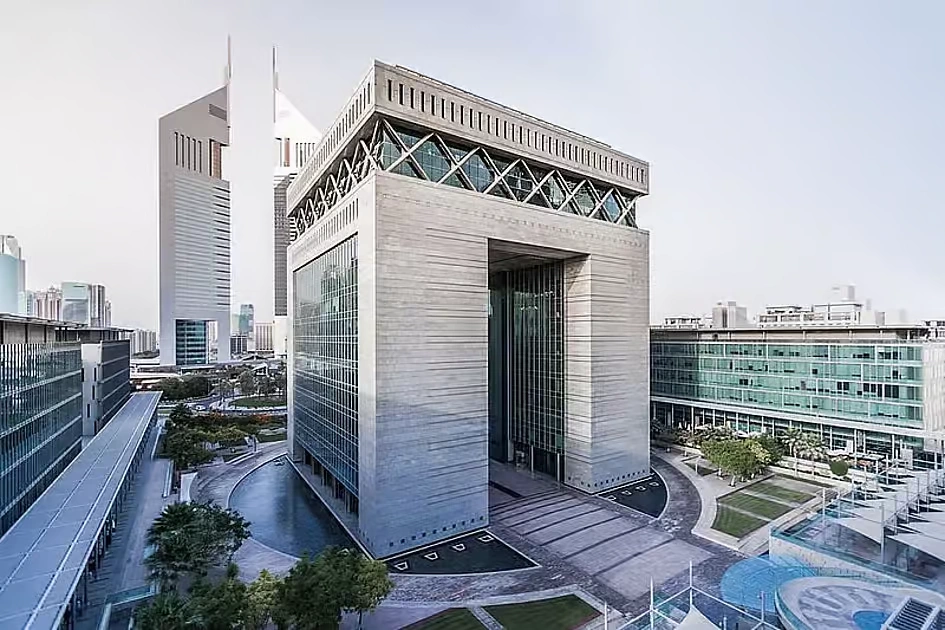
Dubai has climbed to its highest position ever on one of finance’s most closely watched rankings, and the achievement is no accident — it is the direct output of a decade-long, numerically explicit government strategy that few other financial centres have attempted to execute with this level of precision.
The Ranking Itself
The Dubai International Financial Centre has recorded its highest-ever position on the Global Financial Centres Index at seventh place worldwide, the highest ranking ever achieved by any financial centre across the Middle East, Africa and South Asia region, and the only MEASA-region centre to feature in the global top 20 — underscoring both its regional dominance and genuine global competitiveness.
The D33 Strategy Behind the Number
The ranking is explicitly tied to Dubai’s own stated ambitions. The GFCI result is described as pivotal to Dubai’s goal of becoming one of the world’s top four financial centres by 2033, in line with the Dubai Economic Agenda, or D33, which targets a doubling of the emirate’s economy over the decade. Separately, Dubai Chambers has confirmed the plan targets cumulative economic output of AED 32 trillion, or roughly $8.7 trillion, over the decade, supported by 100 transformative projects centred on trade expansion, digital innovation and sustainable growth.
The Underlying Economic Engine
The financial-centre ambitions are backed by genuine current-quarter growth. Dubai’s economy reached AED 232 billion in first-quarter 2026 GDP, a 2.4 percent year-on-year increase, with the finance, construction, healthcare, wholesale and retail trade, and real estate sectors all contributing to the broad-based expansion. Middle East Briefing separately projects the wider UAE economy will expand around 5 percent in 2026, with local banks positioned to increase lending both domestically — supporting SMEs, consumers and project finance — and across borders into markets like Saudi Arabia, where UAE banks’ comparatively lower interbank rates create an arbitrage opportunity.
Real Money Behind the Ranking
The GFCI climb is being validated by tangible transaction volume rather than sentiment alone. Weekly UAE business tracking shows a steady drumbeat of institutional activity: Sharjah Islamic Bank reported AED 803.9 million in net profit, up 15.3 percent, ADI Chain secured a $50 million investment to build sovereign digital infrastructure, and Capital.com reported $1.1 trillion in second-quarter trading volume routed through the jurisdiction. Separately, UAE and Saudi banks are projected to lead GCC credit growth in 2026, reinforcing Dubai and Abu Dhabi’s combined position as the region’s default financial gateway.
Why This Matters for Pakistan and South Asia
Dubai’s ascent as a financial hub carries direct relevance for Pakistan, where — as detailed in our companion coverage of Pakistan’s remittance exposure — roughly 55 percent of the country’s substantial remittance inflows originate from the Gulf Cooperation Council. A deepening, increasingly sophisticated DIFC-anchored financial ecosystem in Dubai means more efficient, lower-cost channels for that capital, alongside growing opportunities for Pakistani and South Asian firms to access GCC-sourced project finance and cross-border credit as UAE banks expand lending beyond their domestic market.
What is Dubai’s global financial centre ranking in 2026?
Dubai’s DIFC recorded its highest-ever ranking on the Global Financial Centres Index at 7th place worldwide in 2026 — the highest ever achieved by any Middle East, Africa or South Asia financial centre — as part of its stated goal to become a top-four global financial hub by 2033.
The Risk Beneath the Growth Story
Not every signal points to unambiguous strength. AGBI’s own reporting notes that UAE banks’ second-quarter results are likely to show weaker profits, slower lending and narrower margins, even as analysts characterise the underlying sector as fundamentally resilient — a reminder that Dubai’s financial-hub ambitions are being pursued against a genuinely more difficult regional operating environment shaped by the Strait of Hormuz disruption and broader Gulf security concerns, not in isolation from them.
The Bottom Line
Dubai’s climb to seventh in the GFCI rankings is less a one-off achievement than a measurable checkpoint on an explicitly numbered, decade-long strategic roadmap — one increasingly backed by real GDP growth, credit expansion, and institutional trading volume rather than ambition alone.
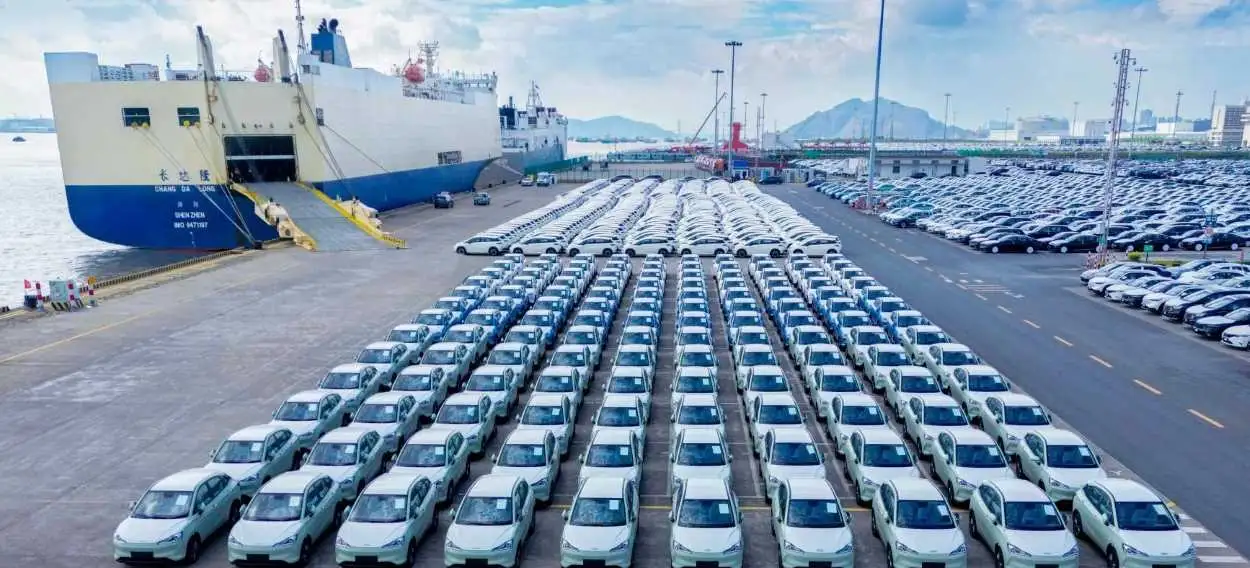
China’s monthly car exports surpassed one million units for the first time in June 2026, according to trade data released alongside the country’s second-quarter GDP figures, while overall imports rose 36% year-over-year to a five-year high even as Beijing cut monthly crude imports to near decade lows, down 41.3% from a year earlier (CNN). The result: China’s trade surplus widened to $125.62 billion in June alone.
The Uncovered Mechanism: Oil Shock as Green-Tech Accelerant
Most coverage has treated China’s electric vehicle and battery export surge as a story purely about domestic manufacturing subsidy and industrial policy. What has received far less attention is the direct causal link to the Iran war: the oil crisis has itself boosted global demand for Chinese clean-energy technology, as energy importers around the world accelerate efforts to reduce fossil-fuel reliance precisely when oil prices are most volatile (CNN). In other words, the same Strait of Hormuz disruption that is damaging Pakistan’s current account and pushing UK inflation higher is simultaneously functioning as a demand accelerant for Chinese EV exports — a direct transmission mechanism linking two of this year’s biggest global stories that is rarely discussed together.
The EU Is Already Losing Patience
China’s widening trade surplus is compounding tensions with the European Union, which has repeatedly criticised Beijing for flooding its market with subsidised industrial exports, a dynamic that predates this year’s conflict but has intensified as Chinese manufacturers redirect capacity toward markets less willing or able to erect the tariff barriers the United States has deployed (CNN; IndexBox).
Why This Is Also a Southeast Asia and Pakistan Story
Malaysia’s own export strength this year has been built substantially on its role in the semiconductor and electronics supply chain feeding the broader AI and green-tech manufacturing boom, meaning Kuala Lumpur benefits indirectly from the same dynamics driving China’s export surge, rather than competing head-on in finished vehicles (The Rakyat Post). Pakistan’s position is more exposed: as a market with its own nascent auto and manufacturing base and limited tariff leverage against Chinese imports, a sustained surge in low-cost Chinese EV and battery exports risks crowding out domestic industrial development at precisely the moment Islamabad is trying to broaden its export base beyond textiles under IMF-monitored reform targets.
The Domestic Trade-Off Beijing Is Managing
China’s export strength is masking, not solving, its domestic consumption weakness. Retail sales rose just 1% year-over-year in June, and analysts including Natixis’s Alicia Garcia-Herrero describe an economy where growth “all about exports” is “really quite unsustainable, to be frank” (CNN). Beijing’s newly released five-year plan to lift annual retail sales toward $9 trillion by 2030 is a direct policy response to this imbalance, but the export engine currently doing the heavy lifting for headline GDP is the same one generating friction with trading partners.
What to Watch
The July Politburo meeting is expected to signal the composition of any new stimulus. A consumption-focused package would ease, over time, the export dependence generating trade friction; an infrastructure-heavy package would likely deepen it, with direct consequences for how aggressively Chinese EV and battery exports continue to expand into markets across Southeast Asia, South Asia and Europe over the second half of 2026.

Pakistan’s Remittance Lifeline: Why Gulf Exposure Is a Hidden Risk

Dubai’s Rise to the World’s 7th Financial Hub: Inside the D33 Push

China EV Exports Hit Record High in 2026

UK’s “National Contributions Tax” Explained: Burnham-Era Reform 2026

Russia’s Strange Problem in 2026: Its Currency Is Too Strong

Section 301 Forced Labor Tariffs 2026: 60 Countries Affected

UK National Contributions Tax: Burnham’s Radical Tax Plan

Global Central Bank Divergence 2026: Why the Fed, BoE, BoJ, and PBoC Are All Moving Differently

Japan’s Bond Market Just Cracked. It Could Take the Rest of the World’s Debt With It

Malaysia’s Ringgit Is Holding Up. Economists Say the Real Test Is Still Coming

Climate Finance Delivery 2026: Trillion‑Dollar Promise Still Unmet

AI Impact on Wages 2026: Productivity Soars, Paychecks Stagnate

SpaceX IPO 2026: $2 Trillion AI Bubble, OpenAI & Anthropic — What Investors Must Know

China Economy 2026: Property Crisis, AI Investment & Export Surplus Explained

Top 15 Stocks for Investment in 2026 in PSX: Your Complete Guide to Pakistan’s Best Investment Opportunities
Top 15 Stocks for Investment in 2026 in PSX: Your Complete Guide to Pakistan’s Best Investment Opportunities

Debunking IMF Program Myths: Reconfiguring Engagement for True National Ownership in a Volatile World

Top 10 Mutual Fund Managers in Pakistan for Investment in 2026: A Comprehensive Guide for Optimal Returns

What the U.S. Attack on Venezuela Could Mean for Oil and Canadian Crude Exports: The Economic Impact

China’s 50% Domestic Equipment Rule: The Semiconductor Mandate Reshaping Global Tech

15 Most Lucrative Sectors for Investment in Pakistan: A 2025 Data-Driven Analysis

Pakistan’s Export Goldmine: 10 Game-Changing Markets Where Pakistani Businesses Are Winning Big in 2025
15 Most Lucrative Sectors for Investment in Pakistan: A 2025 Data-Driven Analysis
15 Most Lucrative Sectors for Investment in Pakistan: A 2025 Data-Driven Analysis

Pakistan’s Economic Outlook 2025: Between Stabilization and the Shadow of Stagnation
Pakistan’s Economic Outlook 2025: Between Stabilization and the Shadow of Stagnation

China’s Property Woes Could Last Until 2030—Despite Beijing’s Best Censorship Efforts
China’s Property Woes Could Last Until 2030—Despite Beijing’s Best Censorship Efforts
-
 Markets & Finance7 months ago
Top 15 Stocks for Investment in 2026 in PSX: Your Complete Guide to Pakistan’s Best Investment Opportunities
-
Markets & Finance7 months ago
Top 15 Stocks for Investment in 2026 in PSX: Your Complete Guide to Pakistan’s Best Investment Opportunities
-
 Analysis6 months ago
Debunking IMF Program Myths: Reconfiguring Engagement for True National Ownership in a Volatile World
-
 Investment6 months ago
Top 10 Mutual Fund Managers in Pakistan for Investment in 2026: A Comprehensive Guide for Optimal Returns
-
 Global Economy7 months ago
What the U.S. Attack on Venezuela Could Mean for Oil and Canadian Crude Exports: The Economic Impact
-
 Asia7 months ago
China’s 50% Domestic Equipment Rule: The Semiconductor Mandate Reshaping Global Tech
-
 AI7 months ago
15 Most Lucrative Sectors for Investment in Pakistan: A 2025 Data-Driven Analysis
-
 Exports7 months ago
Pakistan’s Export Goldmine: 10 Game-Changing Markets Where Pakistani Businesses Are Winning Big in 2025