
Economy & Markets
PSX and KSE-100 Record Highs: An Insider’s Guide to Pakistan Stocks


Pakistan’s equity market has delivered one of the most extraordinary runs in global finance — and then, quietly, stopped.
The KSE-100 reached an all-time high of 189,556 index points earlier in 2026. By mid-September it was trading around 170,000, with a year-to-date change of –1.82% against a 52-week range of 144,119 to 191,033.
That gap between the headline narrative and the current tape is the story most coverage misses.
Key Takeaways
- Where it stands: the KSE-100 closed 18 September 2026 in the 169,000–171,000 band, roughly 11% below its record.
- The three-year run is real: 335% in rupee terms over FY24–FY26, or 347% in dollar terms.
- Foreigners are selling. Net foreign outflows of nearly $900 million during a rally this strong is a warning sign, not a footnote.
- Concentration is the structural risk. A handful of banks and energy names drive most index movement.
- Forecasts are wide: brokerage December 2026 targets range from roughly 203,000 to 263,800.
How the KSE-100 Got Here
The index was launched in November 1991 with a base of 1,000 points. It first crossed 15,000 in April 2008 — meaning the move from there to 189,000 represents more than a twelvefold nominal gain, though rupee depreciation absorbs a large share of that.
The recent leg is more instructive. The KSE-100 gained roughly 44% in rupee terms in fiscal year 2026, outperforming nearly every major asset class for a third consecutive year. Analysts attribute the run to macroeconomic stabilisation under Pakistan’s IMF programme, policy continuity, and the country’s return to international debt markets.
The 2026 Round Trip
The year has not been a straight line:
| Period | KSE-100 Level | Driver |
|---|---|---|
| January 2026 | Intraday high near 189,167 | Peak momentum, domestic institutional inflows |
| March 2026 | Correction to 146,480 | Iran–US/Israel conflict, oil price spike |
| Mid-2026 | Recovery above 180,000 | Conflict de-escalation, energy prices easing |
| Mid-September 2026 | 169,000–171,000 | Consolidation, foreign selling |
The March drawdown — roughly 22% peak to trough — is the single most useful data point for anyone sizing a Pakistan position. It shows exactly how the index behaves when oil moves against an import-dependent economy.
Reading the Daily Tape
Recent sessions show a market with domestic bid support but no conviction breakout. On 17 September the KSE-100 closed at 169,043, up 1,021 points, with volume around 125 million shares and traded value of Rs13.45 billion. Exploration and production stocks contributed the most (339 points), followed by commercial banks (304) and cement (149).
Two days earlier the index surged 1,421.67 points to 169,392, taking total market capitalisation to Rs18.857 trillion.
That sector mix — E&P, banks, cement — is the KSE-100. If you have a view on Pakistani equities, you have a view on oil, interest rates and construction activity. Everything else is noise around the edges.
The Three Risks Nobody Puts in the Headline
1. Foreign Investors Are Not Convinced
Nearly $900 million of net foreign selling during a rally of this magnitude suggests international institutions view the move as domestically funded and potentially fragile. Domestic mutual funds and insurance companies have been the marginal buyer.
This matters because foreign flows historically set the ceiling in frontier markets. A rally without them can continue — but it tends to reverse faster.
2. Concentration Risk
A small group of heavyweights — UBL, OGDC, Engro, HBL, Lucky Cement and Bank Alfalah — has driven a disproportionate share of index gains. United Bank Limited overtook Oil & Gas Development Company as Pakistan’s largest listed company by market capitalisation in early 2026.
An index-tracking position in Pakistan is effectively a leveraged bet on domestic banking margins.
3. Geopolitical and Commodity Sensitivity
Pakistan imports the majority of its energy. The World Bank’s June 2026 Global Economic Prospects flags exactly this transmission channel, noting that emerging market and developing economies dependent on energy imports face the weakest per capita income growth since the pandemic.
The March correction was that risk crystallising in real time.
Valuation and the 2027 Question
Brokerage targets for December 2026 diverge sharply: roughly 203,000 from Topline against 263,800 from AKD Research. The bullish case, if realised, would push PSX market capitalisation past $100 billion for the first time.
That spread — about 30% between two credible houses — tells you the market’s direction is genuinely contested, not consensus.
| Scenario | Index Path | Requires |
|---|---|---|
| Base | 190,000–205,000 by year-end | Policy rate cuts, stable currency, IMF review passed |
| Bull | 240,000+ | Foreign inflows return, oil below $80, earnings upgrades |
| Bear | Retest of 150,000 | Energy shock, IMF programme friction, political disruption |
How to Invest in Pakistani Stocks
For domestic investors:
- Open a CDC sub-account through a PSX-licensed broker; check the Pakistan Stock Exchange broker directory.
- Decide between index exposure and stock selection. Given concentration, an index position is not as diversified as it appears.
- Match sector exposure to your macro view. Banks benefit from high rates; cement and autos benefit from cuts. They cannot both work.
- Track the IMF review calendar. Programme milestones have moved this market more reliably than earnings.
For foreign investors, the practical constraints are repatriation mechanics, custody arrangements and liquidity. Daily traded value of roughly Rs13–17 billion (approximately $45–60 million) means institutional-size positions take days to build and longer to exit.
What This Means for the Global Market in 2027
Frontier markets are being repriced on macro discipline, not growth. Pakistan’s re-rating tracked IMF compliance and external account stabilisation more closely than it tracked corporate earnings. That template now applies across frontier Asia.
Foreign flows are the missing catalyst. The single variable most likely to determine whether 2027 delivers 203,000 or 263,800 is whether international institutions reverse their selling.
Oil remains the dominant external variable. With the IMF projecting global growth of 3.0% in 2026 and 3.4% in 2027 under conditions where energy importers bear the heaviest burden, Pakistan’s index is effectively short crude.
Index upgrades are the structural prize. Any move toward emerging-market classification would force passive allocation into a market that currently receives almost none.
Currency is the hidden return driver. Dollar-denominated returns exceeded rupee returns in FY26 — an unusual and unsustainable configuration that foreign investors should not extrapolate.
Frequently Asked Questions
What is the KSE-100 index today?
The KSE-100 traded between 169,400 and 171,037 on 18 September 2026, with a previous close of 169,043. Its 52-week range is 144,119 to 191,033.
Is the Pakistan Stock Exchange a good investment in 2026?
It delivered roughly 44% in rupee terms in FY26 but is slightly negative year-to-date in calendar 2026. Returns depend heavily on oil prices, policy rates and IMF programme continuity.
Why are foreign investors selling Pakistani stocks?
Net foreign outflows approached $900 million during the recent rally, suggesting international institutions are unconvinced the domestically funded move is durable.
What is the KSE-100 forecast for December 2026?
Brokerage targets range from about 203,000 (Topline) to 263,800 (AKD Research). The wide spread reflects genuine disagreement on foreign flows and energy prices.


Key Takeaways
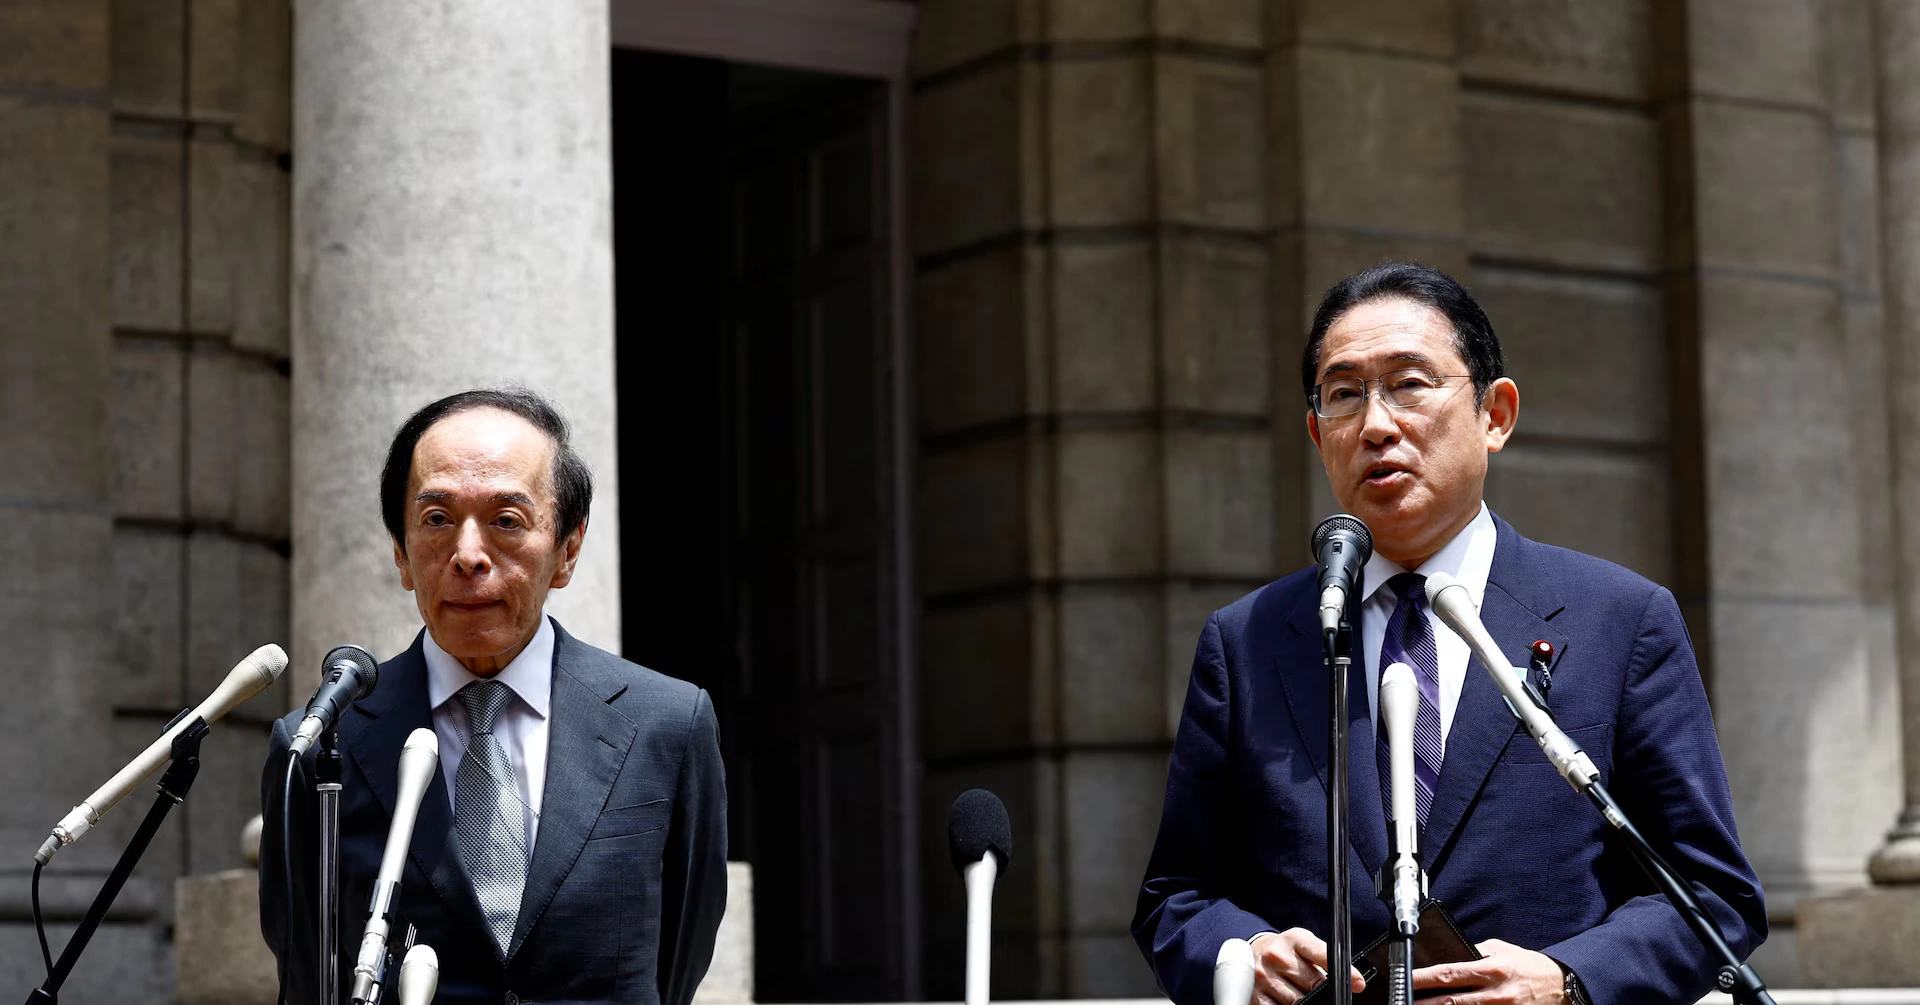
- Japan is considering nearly doubling its midterm defense spending target to 3.5% of GDP — up from current levels of roughly 1.9% — under pressure from the Trump administration to match commitments made by NATO members and South Korea.
- A 3.5% target would amount to roughly ¥24 trillion annually, based on current GDP forecasts, more than double today’s spending level; a lower 3.0% target is also reportedly under consideration.
- Japanese 10-year government bond yields have already climbed to their highest levels since 1996, reflecting investor concern about how Japan — which carries the world’s highest debt-to-GDP ratio among advanced economies at nearly 240% — would finance the increase.
- Defense contractor stocks on the Tokyo Stock Exchange have risen in anticipation of the spending shift, even as broader market strategists warn the announcement could “send a shockwave through financial markets” concerned about PM Sanae Takaichi’s overall fiscal trajectory.
- A new five-year defense spending plan is expected by the end of 2026, meaning markets will be watching for confirmation of the final target — 3.0% or 3.5% — in the coming months.
Japan’s defense budget has broken its own record for 14 consecutive years, but the shift now under consideration in Tokyo represents something categorically different: a near-doubling of the country’s spending target, driven not by regional threat assessments alone but by direct pressure from Washington. For global economy watchers, the implications reach well beyond defense contractors into Japanese government bond markets, the yen, and the Bank of Japan’s already delicate policy path.
The New Target Under Consideration
According to people familiar with the matter, Japan’s government — under Prime Minister Sanae Takaichi — is weighing a new midterm defense spending target of 3.5% of GDP, aligning with commitments already made by NATO members and, more strikingly, by South Korea, which has pledged to reach that level over 10 years. Japanese defense officials have reportedly already signaled willingness to sharply increase spending in meetings with their US counterparts, though a lower 3.0% target remains an alternative under discussion.
To put the scale of this shift in context: until 2022, Japan maintained an informal spending ceiling around just 1% of GDP — a figure rooted in the country’s post-war pacifist constitutional framework. Takaichi has already accelerated Japan toward the more modest 2% target two years ahead of schedule, reaching nearly that level in the fiscal year ended March 2026. A jump to 3.5% would represent roughly ¥24 trillion in annual spending based on current GDP projections — more than double the current outlay, and a figure that dwarfs the roughly ¥9-10 trillion currently being requested for the next fiscal year’s defense budget alone.
Why Now: US Pressure and the NATO Benchmark
The push traces directly to the Trump administration’s broader effort to have allies shoulder more of their own defense costs and reduce reliance on the American military umbrella. The 3.5%-of-GDP figure has effectively become a global benchmark for US allies since NATO members adopted it, with Japan’s neighbors South Korea and Taiwan reportedly making similar pledges. For Tokyo specifically, the pressure carries added urgency given ongoing regional security concerns and the broader reassessment of US alliance commitments happening globally in 2026.
Notably, even Takaichi’s more modest current-year progress — nearing 2% of GDP two years ahead of schedule — already drew praise in Washington, but analysts at the Center for Strategic and International Studies have noted this success is likely to raise expectations for even further increases in Japan’s next defense buildup program, expected to be finalized by the end of 2026.
The Fiscal Math Problem
Japan’s fiscal starting position makes this proposal considerably more fraught than a simple budget-line adjustment. The country already carries the world’s highest debt-to-GDP ratio among advanced economies, at nearly 240% — meaning any large new spending commitment raises immediate questions about financing, whether through new bond issuance, tax increases, or some combination. Takaichi has publicly pledged to pursue a “responsible, proactive fiscal policy,” but bond markets are already signaling skepticism: Japanese 10-year government bond yields have climbed to their highest levels since 1996, reflecting growing investor concern about debt sustainability even before any formal 3.5% commitment is finalized.
Bond Market and Equity Reaction
The market response so far has bifurcated in a telling way. On one hand, major Japanese defense companies have risen on the Tokyo Stock Exchange as investors price in the prospect of substantially higher government contracts. On the other, the broader bond market reaction has been notably more cautious — rising JGB yields reflect concern that large new debt issuance to fund the buildup could strain Japan’s already stretched fiscal position, with potential knock-on effects for borrowing costs across the economy.
Spending Target Comparison
| Scenario | Target (% of GDP) | Est. Annual Spending | Status |
|---|---|---|---|
| Pre-2022 informal ceiling | ~1.0% | N/A | Historical baseline |
| Current target (achieved early) | ~2.0% | ~¥9-10 trillion | Reached FY2026, 2 years ahead of schedule |
| Under consideration (lower option) | 3.0% | N/A | Reportedly discussed |
| Under consideration (NATO-aligned option) | 3.5% | ~¥24 trillion | Reportedly discussed; matches South Korea’s 10-year pledge |
Why This Matters for the BOJ and Global Markets
A defense-spending shift of this magnitude complicates an already difficult picture for the Bank of Japan, which has been gradually moving away from decades of ultra-loose monetary policy even as it monitors the same Middle East-driven inflation pressures affecting central banks globally. Rising JGB yields tied to defense-spending concerns could interact with — and potentially amplify — the BOJ’s separate rate-hike considerations tied to domestic inflation, creating a more complex policy balancing act than either factor would present alone.
There’s also a broader global bond-market angle: some strategists have pointed to Japan’s rising rates as a factor behind a potential unwinding of the long-popular yen carry trade, in which investors borrow cheaply in Japan to invest in higher-yielding assets elsewhere. As Japanese yields climb — whether from defense spending, BOJ policy, or both — that trade becomes progressively less attractive, a dynamic some analysts have linked to recent volatility in global government bond markets more broadly, including the US Treasury market’s own yield surge this same week.
Frequently Asked Questions
Why is Japan considering raising defense spending to 3.5% of GDP?
The shift is driven primarily by pressure from the Trump administration for US allies to spend more on their own defense, aligning with commitments already made by NATO members and Japan’s neighbor South Korea, which pledged to reach 3.5% of GDP over 10 years.
How would Japan pay for a defense spending increase to 3.5% of GDP?
This remains unresolved and is a major market concern — Japan already carries the world’s highest debt-to-GDP ratio among advanced economies at nearly 240%, and rising Japanese government bond yields suggest investors are pricing in financing concerns ahead of any formal commitment.
When will Japan finalize its new defense spending target?
A new five-year defense spending plan is expected to be released by the end of 2026, which should clarify whether Japan settles on the 3.0% or 3.5% of GDP target currently under consideration.

Key Takeaways
- The KSE-100 index closed FY2025-26 at 180,301 points, a 44% rupee-terms gain for the fiscal year, and has posted a 335% three-year cumulative return across FY24–FY26.
- As of mid-September 2026, the index trades around 170,500, down roughly 5.4% over the past month but still +10.4% year-over-year, after touching an all-time intraday high above 189,500.
- Pakistan’s rally is anchored in a disbursing IMF Extended Fund Facility (EFF) program, improving FX reserves, and record remittance inflows — but the market remains highly sensitive to Middle East escalation risk.
- A key IMF mission review is expected around September 23, 2026, alongside ongoing monitoring of the Strait of Hormuz situation, both of which could swing the index materially in either direction.
- The IMF’s July 2026 World Economic Outlook projects global growth of 3.0% in 2026 and 3.4% in 2027, with emerging markets like Pakistan navigating this backdrop unevenly depending on their energy exposure.
Pakistan’s stock market has quietly delivered one of the best multi-year runs of any major frontier or emerging market, even as the country’s headlines remain dominated by floods, fiscal deficits, and geopolitical tension. For investors trying to separate durable reform momentum from short-term noise, this PSX and KSE forecast walks through the fiscal-year numbers, the IMF and World Bank data underpinning the rally, and the risks that could still derail it heading into Q4 2026.
The FY26 Scorecard: A Record-Breaking Year
The Pakistan Stock Exchange’s benchmark KSE-100 Index closed fiscal year 2025-26 (ending June 30, 2026) at 180,301 points, up 44% from 125,627 at the close of FY25. Extend the window further and the picture gets even more striking: across FY24, FY25, and FY26 combined, the index delivered a cumulative gain of 335% in rupee terms (347% in USD terms) — a run that ranks among the best-performing major equity markets globally over that stretch, according to analysis from Business Recorder.
The fiscal year itself was a story of two distinct halves. In the first half of FY26, the market returned 39%, driven by improving economic indicators despite the July–August 2025 floods. The second half was far choppier, returning just 4% overall and including a sharp pullback to an intraday low of 146,480 on March 9, 2026 amid escalating Middle East geopolitical tension — a reminder that Pakistan’s domestic reform story cannot fully insulate the market from external shocks.
Where the Index Stands Today
As of September 11, 2026, the KSE-100 traded at roughly 170,512 points, up 0.98% on the session but down 5.43% over the trailing month. Even after that pullback, the index remains 10.41% higher year-over-year. Trading Economics data shows the index has touched an all-time high above 189,556 points during 2026, underscoring just how volatile the second half of the fiscal year has been relative to the steady climb of the first half.
The IMF Anchor: Why It Matters More Than Ever
Pakistan’s macro stability story in 2026 is inseparable from its IMF-supported program — a $7 billion Extended Fund Facility (EFF) combined with a Resilience and Sustainability Facility (RSF) arrangement. Analysts at economy-focused outlets have described the continuation of this program as “another major pillar supporting macroeconomic stability,” since it facilitates external financing and reinforces investor confidence at a time when Pakistan’s own reserve buffers remain thin relative to import needs.
A closely watched IMF mission review around September 23, 2026 stands out as a near-term catalyst. Historically, PSX rallies have coincided tightly with positive IMF review outcomes — the market’s sharpest single-day gain in 26 years, a 9.45% surge, followed confirmation of IMF loan approval alongside a Pakistan-India ceasefire earlier in the current multi-year rally. A disappointing review outcome, by contrast, has historically triggered rapid, double-digit-percentage pullbacks.
How Pakistan Fits the IMF’s Global Growth Picture
The IMF’s July 2026 World Economic Outlook Update — among the most important IMF Reports for emerging-market investors this year — projects global growth of 3.0% for 2026 and 3.4% for 2027, broadly unchanged cumulatively from April. The Fund frames the global picture as a tug-of-war between two forces: a negative supply shock from the Middle East war weighing on energy importers, and a positive technology investment cycle lifting countries integrated into AI-driven global supply chains.
Pakistan sits closer to the vulnerable side of that divide as a net energy importer, which is precisely why the KSE-100’s resilience through 2026 — despite the war, despite a global inflation forecast revised up to 4.7% for 2026 — has impressed regional analysts. The World Bank’s parallel commentary on frontier and emerging Asian markets has similarly flagged energy-import exposure as the key swing factor for growth and currency stability across the region through year-end.
KSE-100 Performance Snapshot
| Period | KSE-100 Level | Change |
|---|---|---|
| End of FY25 (June 30, 2025) | 125,627 | — |
| End of FY26 (June 30, 2026) | 180,301 | +44% (FY26) |
| Intraday low (March 9, 2026) | 146,480 | Middle East tension selloff |
| All-time intraday high (2026) | 189,556 | — |
| Current level (Sept 11, 2026) | ~170,512 | -5.43% trailing month, +10.41% YoY |
Why This Matters for Investors: The Bull and Bear Case
The bull case rests on three durable pillars: a disbursing, credible IMF program extending into FY27; strengthening FX reserves; and record remittance inflows that continue to support the rupee independent of equity flows. Trailing valuations remain in the single-digit P/E range by several analyst estimates — cheap by both historical and regional emerging-market standards, even after the multi-year rally.
The bear case is just as concrete: the index’s near-term direction is now, in the words of one PSX-focused analysis, “a leveraged bet on Middle East de-escalation as much as on domestic policy execution.” Any material escalation around the Strait of Hormuz, or a disappointing outcome from the September 23 IMF mission, could swing the index by double-digit percentages within weeks — as the March 2026 pullback already demonstrated.
Frequently Asked Questions
Is the KSE-100 still a good investment after its 44% FY26 gain?
Analysts remain constructively positioned given single-digit trailing P/E multiples and continued IMF program support into FY27, though the market’s sensitivity to Middle East escalation means near-term volatility should be expected regardless of the longer-term reform trajectory.
What is driving the KSE-100’s volatility in 2026?
The index’s first-half FY26 gains were driven by improving domestic macroeconomic indicators, while second-half volatility — including a sharp March 2026 pullback — has been driven primarily by escalating Middle East geopolitical tension and its impact on oil-import costs.
How does the IMF’s global economy outlook affect Pakistan specifically?
The IMF’s July 2026 forecast of 3.0% global growth and 4.7% global inflation for 2026 reflects a world split between energy-importer headwinds and AI-driven technology tailwinds. As a net energy importer, Pakistan faces more of the former, making its IMF program and FX reserve trajectory especially important to watch.

Every housing cycle produces a chorus of crash predictions, and 2026 has been no exception. But the data emerging through the third quarter tells a more measured story than the headlines suggest: this is a market undergoing what several major forecasters are now calling “The Great Recalibration” — not a collapse, but a prolonged, uneven reset in which affordability improves slowly, regionally, and unevenly rather than through a sharp price correction.
Key Takeaways
- No major forecaster — Fannie Mae, NAR, Zillow, Redfin, or Realtor.com — is projecting a national home price crash in 2026; forecasts cluster in a 1% to 4% annual price growth range.
- Existing home sales fell 4.2% in the first half of 2026, with June sales down 2.4% to a seasonally adjusted annual rate of 4.09 million units, according to the National Association of Realtors — softness driven by elevated mortgage rates, not distressed selling.
- 30-year fixed mortgage rates are expected to average roughly 6.3% through 2026, per consensus forecasts from Realtor.com, Redfin, and industry surveys — a “new equilibrium” rather than a return to sub-5% pandemic-era rates.
- Home values fell in 24 of the 50 largest US markets as of late 2025; Zillow projects that number to roughly halve to around 12 markets in 2026, indicating regional divergence rather than a uniform correction.
- Nearly two-thirds of prospective buyers (62%) have been waiting for rates to fall before purchasing — the same share that made the identical bet in 2025 and were wrong, underscoring the risk of timing the market on rate predictions alone.
The State of the 2026 Housing Market: Reset, Not Crash
The consensus among major housing economists — at Redfin, Zillow, NAR, Fannie Mae, and J.P. Morgan Global Research — is unusually aligned for a sector prone to disagreement: 2026 is a “recalibration” year, characterized by softening sales volume, modest price growth, and mortgage rates settling into a new, higher-than-pandemic-era range rather than a sharp downward price correction.
J.P. Morgan Global Research’s mid-2026 housing outlook noted that existing home sales pulled back 2.4% in June to a seasonally adjusted annual rate of 4.09 million units, extending a first-half 2026 decline of 4.2%. The bank attributed the softness directly to elevated mortgage rates rather than to distressed inventory or forced selling — a critical distinction from the dynamics that preceded the 2008 crash, where oversupply and subprime defaults, not rate-driven demand softness, drove the collapse.
Mortgage Rate Trajectory: The Central Variable
Mortgage rates remain the single most important variable shaping the 2026 housing market. Forecasts have converged around an average 30-year fixed rate near 6.3% for the year, with Fannie Mae’s Home Price Expectations Survey — which polls more than 100 housing economists — projecting home prices to rise a modest 1.7% in 2026 and 2% in 2027 under that rate assumption. Some forecasters see slightly more optimistic paths: S&P Global has projected an average closer to 5.77%, while Zillow has taken the more cautious position that rates will likely stay above 6% throughout 2026 despite gradual easing.
| Forecaster | 2026 Home Price Growth | 2026 Mortgage Rate (30-yr avg) |
|---|---|---|
| Fannie Mae | +3.2% | ~6.3% |
| National Association of Realtors | +4.0% (median price) | ~6.3% |
| Mortgage Bankers Association | +0.6% | ~6.3% |
| Realtor.com | +2.2% | ~6.3% |
| Zillow | +1.2% | Above 6% |
| Redfin | +1.0% | Low 6% range |
No forecaster in this table projects a price decline — the dispersion is between “modest growth” and “very modest growth,” which is the clearest quantitative rebuttal to crash narratives currently circulating in social media and lower-authority financial commentary.
Regional Divergence: Where the Real Risk Sits
The national picture obscures significant regional variation, and this is where “crash predictions” have the most factual grounding — at the metro level, not the national level. Zillow’s research noted that home values fell in 24 of the 50 largest US markets as of October 2025, with that number of declining markets expected to roughly halve to about 12 in 2026 as affordability improves. This implies that roughly a quarter of major US metros experienced genuine, if modest, price depreciation heading into 2026 — a regional reality that gets flattened into “national crash” narratives online but is more accurately described as localized correction concentrated in previously overheated Sun Belt and pandemic-boomtown markets.
Inventory: The Structural Wildcard
Inventory levels are projected to increase by approximately 8.9% to 12% in 2026, according to appraisal-industry forecasting, though they remain below pre-pandemic averages. This matters directly for crash risk: a genuine price collapse typically requires oversupply relative to demand. Current inventory growth, even at the high end of forecasts, is not projected to push supply into the oversupplied territory that preceded the 2008 downturn — it is a gradual normalization from historically tight conditions, not a supply glut.
The “Waiting for Rates to Fall” Trap
One of the more revealing data points for 2026 buyer psychology comes from a U.S. News survey: nearly two-thirds of prospective homebuyers (62%) were waiting for mortgage rates to fall before buying in 2026 — and the identical share (62%) made the same bet in 2025, and lost it, as rates did not fall meaningfully. This is a behavioral pattern directly analogous to the cash-hoarding trap in personal savings: postponing action based on a rate prediction that forecasters themselves have repeatedly gotten wrong carries its own opportunity cost, particularly if home prices continue their modest upward drift as most forecasters project.
Mortgage Rate Strategies for 2026 Buyers and Owners
- Rate locks with float-down options. With rates expected to hover in a narrow 6.0%–6.5% band rather than swing dramatically, a float-down provision on a rate lock offers modest downside protection without requiring buyers to time a broader market move.
- Adjustable-rate mortgages for shorter holding periods. For buyers expecting to sell or refinance within 5–7 years, ARMs priced meaningfully below the 6.3% fixed-rate consensus can reduce carrying costs without exposure to a 30-year rate commitment.
- Points purchases in a stable-rate environment. Because forecasters see rates stabilizing rather than falling sharply, buying down the rate with points becomes more mathematically attractive than in a falling-rate environment where a near-term refinance might otherwise recapture the cost.
- Regional due diligence over national headlines. Given that roughly a quarter of major metros were still seeing price declines heading into 2026, buyers and investors should underwrite specific metro-level inventory and price-trend data rather than relying on national crash or boom narratives.
Frequently Asked Questions
Is the US housing market going to crash in 2026?
No major housing forecaster — including Fannie Mae, NAR, Zillow, Redfin, and the Mortgage Bankers Association — projects a national price decline in 2026; forecasts range from roughly 0.6% to 4% price growth, with existing home sales projected to be flat to modestly higher.
Why do home sales keep falling if prices aren’t crashing?
Existing home sales fell 4.2% in the first half of 2026 primarily because elevated mortgage rates (averaging around 6.3%) are suppressing transaction volume, not because of distressed or forced selling — a key structural difference from the 2008 crash.
Should I wait for mortgage rates to drop before buying?
Roughly 62% of buyers made this bet in both 2025 and 2026, and rates did not fall meaningfully either year according to consensus forecasts; buyers evaluating this strategy should weigh the opportunity cost of continued modest home-price appreciation against uncertain rate movement.
Conclusion
The 2026 real estate data supports a “Great Recalibration” thesis, not a crash thesis: sales volume is softening under the weight of a stabilized-but-elevated 6.3% mortgage rate environment, national price growth remains positive across every major forecaster, and the genuine downside risk is concentrated regionally in a shrinking subset of previously overheated metros rather than distributed nationally. For buyers, sellers, and investors, the 2026 opportunity lies less in timing a crash that the data does not support and more in navigating rate strategy and regional selection with precision.

PSX and KSE-100 Record Highs: An Insider’s Guide to Pakistan Stocks

So Delicious Dessert Recall: Affected Products, FDA Guidelines, and Consumer Action

Pakistan’s Current Account Deficit Narrows Sharply to $98 Million in August 2026

Japan Eyes 3.5% Defense Spending: What It Means for Bonds, Stocks, and the BOJ

PSX & KSE Forecast 2026: Navigating the Latest IMF Reports & World Bank Metrics

Trump Administration’s Crypto Policy: Deregulation and the Future of Digital Assets

Monetary Policy and the Policy Rate

Gold, Silver & Bitcoin Prices Q4 2026: Wealth Management Strategies

Business Insurance for Digital Exports: Protecting Your Company in the AI Era

Real Estate Crash Predictions 2026: Data-Backed Regional Guide

What is a “Lead-Left” Bank? Unpacking Morgan Stanley’s Role in Anthropic’s Mega-IPO

Is SPY Overvalued in September 2026? Fed Rate Hike Odds & Intrinsic Value

Pakistan’s KSE-100 Nears Record Territory Even as the Trade Gap Persists

US Consumer Sentiment Sinks as Retail Sales Drop

Top 15 Stocks for Investment in 2026 in PSX: Your Complete Guide to Pakistan’s Best Investment Opportunities
Top 15 Stocks for Investment in 2026 in PSX: Your Complete Guide to Pakistan’s Best Investment Opportunities

Debunking IMF Program Myths: Reconfiguring Engagement for True National Ownership in a Volatile World

Top 10 Mutual Fund Managers in Pakistan for Investment in 2026: A Comprehensive Guide for Optimal Returns

China’s 50% Domestic Equipment Rule: The Semiconductor Mandate Reshaping Global Tech

What the U.S. Attack on Venezuela Could Mean for Oil and Canadian Crude Exports: The Economic Impact

15 Most Lucrative Sectors for Investment in Pakistan: A 2025 Data-Driven Analysis

Pakistan’s Export Goldmine: 10 Game-Changing Markets Where Pakistani Businesses Are Winning Big in 2025
15 Most Lucrative Sectors for Investment in Pakistan: A 2025 Data-Driven Analysis
15 Most Lucrative Sectors for Investment in Pakistan: A 2025 Data-Driven Analysis

Pakistan’s Stock Market Renaissance: How 2025’s Hottest Investment Opportunity Is Democratizing Wealth—A Complete Beginner’s Guide

Pakistan’s Economic Outlook 2025: Between Stabilization and the Shadow of Stagnation
Pakistan’s Economic Outlook 2025: Between Stabilization and the Shadow of Stagnation

China’s Property Woes Could Last Until 2030—Despite Beijing’s Best Censorship Efforts
-
 Markets & Finance9 months ago
Top 15 Stocks for Investment in 2026 in PSX: Your Complete Guide to Pakistan’s Best Investment Opportunities
-
Markets & Finance9 months ago
Top 15 Stocks for Investment in 2026 in PSX: Your Complete Guide to Pakistan’s Best Investment Opportunities
-
 Analysis8 months ago
Debunking IMF Program Myths: Reconfiguring Engagement for True National Ownership in a Volatile World
-
 Investment8 months ago
Top 10 Mutual Fund Managers in Pakistan for Investment in 2026: A Comprehensive Guide for Optimal Returns
-
 Asia9 months ago
China’s 50% Domestic Equipment Rule: The Semiconductor Mandate Reshaping Global Tech
-
 Global Economy9 months ago
What the U.S. Attack on Venezuela Could Mean for Oil and Canadian Crude Exports: The Economic Impact
-
 AI9 months ago
15 Most Lucrative Sectors for Investment in Pakistan: A 2025 Data-Driven Analysis
-
 Exports9 months ago
Pakistan’s Export Goldmine: 10 Game-Changing Markets Where Pakistani Businesses Are Winning Big in 2025