
Investment
Pakistan Stock Surge: KSE-100 Hits Record 188,000+ on Rate Cut Bets


KSE-100 index soars past 188,621 points amid Pakistan stock market rally fueled by SBP rate cut expectations. Analysis of drivers, risks, and global emerging market context for January 2026.
A Frontier Market’s Unexpected Ascent
The trading floor at the Pakistan Stock Exchange opened Tuesday morning with the nervous energy that has become characteristic of frontier markets in early 2026. By midday, the benchmark KSE-100 index had tumbled to an intraday low of 187,192 points, triggering familiar anxieties among investors who remember Pakistan’s volatility all too well. Yet what followed was a dramatic reversal that encapsulates the peculiar momentum gripping this South Asian economy.
The KSE-100 surged 860 points to close at a record 188,621.78, marking not just another milestone but a continuation of what has become one of the most compelling—and confounding—bull runs in emerging markets. For investors watching from afar, Pakistan’s bourse suddenly looks less like a frontier gamble and more like an opportunity that demands serious consideration.
The rally extends a remarkable streak. Over the past month alone, the index has climbed 10.20 percent, and stands up 63.99 percent compared to the same period last year, according to data from Trading Economics. This isn’t the ephemeral bounce of speculative fervor; it’s a sustained ascent driven by fundamentals that are quietly reshaping Pakistan’s investment narrative.
The January 20 Session: Volatility Gives Way to Conviction
Tuesday’s trading session offered a microcosm of Pakistan’s current market dynamics. The index swung between an intraday high of 188,958.38 and its morning low of 187,192.02, a range reflecting both persistent uncertainty and growing confidence. The volatility wasn’t surprising—frontier markets rarely move in straight lines—but the decisive close above 188,600 points signaled something more substantial than mere momentum.

Volume remained robust, with market participants noting sustained buying interest across heavyweight sectors. According to analysis from KTrade Securities, all-share traded volumes rose 2.3 percent day-over-day to 1,226 million shares, suggesting broad participation rather than narrow speculation. The breadth of the rally—spanning energy, financials, and fertilizers—indicates institutional conviction rather than retail exuberance.
Heavy stocks drove the gains. Engro Holdings, Pakistan Petroleum, Sazgar Engineering, Oil and Gas Development Company, and Pakistan State Oil collectively added 661 points to the index, underscoring how Pakistan’s largest companies are benefiting from improving macroeconomic conditions and sector-specific tailwinds.
The Rate Cut Catalyst: Monetary Easing in Focus
At the heart of Tuesday’s rally—and indeed, much of the recent bullishness—lies a simple calculation: investors are betting heavily that the State Bank of Pakistan will announce a rate cut at its Monetary Policy Committee meeting scheduled for January 26. The conviction behind this bet is remarkably strong.
Survey data indicates that approximately 80 percent of market participants expect the SBP to reduce interest rates, with 56 percent predicting a 50 basis point cut and 15 percent foreseeing a full percentage point reduction. These aren’t idle expectations. They’re grounded in a macroeconomic reality that has shifted dramatically over the past several months.
The central bank surprised markets in December by cutting rates 50 basis points to 10.5 percent, even as many analysts had forecast rates would remain on hold. The move followed the IMF’s approval of a $1.2 billion disbursement, which bolstered foreign exchange reserves to over $15.8 billion, according to Trading Economics data. That cut signaled the SBP’s confidence that inflation was being durably tamed without requiring the punishingly high real interest rates that had characterized much of 2024 and early 2025.
Market pricing now reflects expectations of further easing. Looking ahead, nearly 49 percent of survey participants believe the policy rate will remain at 10 percent until June 2026, while 46 percent expect it to fall below 10 percent. If realized, such cuts would represent a remarkable pivot from the 22 percent peak reached during Pakistan’s acute inflation crisis.
The broader context matters enormously. Pakistan’s real interest rate—the policy rate minus inflation—currently stands at approximately 450 basis points, well above the historical average of 200-300 basis points for the country. This substantial buffer provides the SBP meaningful room to ease without risking inflation expectations becoming unanchored.
Inflation’s Cooling Trajectory
The foundation for monetary easing rests on Pakistan’s remarkable inflation performance. After experiencing devastating price pressures that saw annual inflation surge above 30 percent in 2023, the country has achieved a disinflation that would have seemed implausible just 18 months ago.
Pakistan’s annual inflation eased to 5.6 percent in December 2025 from 6.1 percent in November, marking the lowest reading since August. More critically, this deceleration appears broad-based rather than driven by volatile components. Food and non-alcoholic beverage inflation decelerated significantly to 3.2 percent from 5.5 percent in November, with perishable food prices declining 17.8 percent, according to Trading Economics.
For a country where food comprises a substantial portion of household consumption baskets, this moderation provides genuine relief to ordinary Pakistanis while simultaneously creating space for the central bank to support growth through lower rates. The combination of falling inflation and a still-elevated policy rate creates what economists term “real policy easing”—even if nominal rates are unchanged, declining inflation makes monetary conditions more accommodative.
The inflation trajectory looks sustainable. Core inflation, which strips out volatile food and energy prices, has also moderated, though it remains somewhat sticky. The central bank’s target range of 5-7 percent appears achievable for the foreseeable future, barring external shocks.
The IMF Anchor: Credibility Through Commitment
Pakistan’s relationship with the International Monetary Fund has been tumultuous over decades—a pattern of crisis lending, temporary stabilization, and eventual backsliding that eroded investor confidence. The current program, however, appears different in execution if not always in rhetoric.
The successful completion of recent IMF reviews and the subsequent $1.2 billion disbursement represents more than just liquidity provision. It signals external validation of Pakistan’s fiscal and monetary policy trajectory, providing a credibility anchor that domestic institutions often struggle to establish independently.
The Monetary Policy Committee noted that despite sizable ongoing debt repayments, SBP’s foreign exchange reserves continued to increase, reaching above $15.8 billion, according to the December policy statement. Moreover, with the realization of planned official inflows, SBP’s reserves are projected to strengthen to $17.8 billion by June 2026.
These aren’t trivial numbers for Pakistan. Reserve adequacy has historically been a vulnerability—periods when reserves dipped below three months of import cover triggered currency crises and capital flight. The current trajectory, if sustained, would represent the strongest reserve position in recent memory, providing a crucial buffer against external shocks.
The fiscal side shows improvement as well, though challenges persist. Led by sizable SBP profit transfer, the overall and primary fiscal balances recorded surpluses during the first quarter of fiscal year 2026. However, tax collection remains a persistent weakness, with revenue growth lagging targets and necessitating potentially painful adjustments in coming months.
Economic Activity: Green Shoots Amid Caution
Beyond monetary and fiscal metrics, Pakistan’s real economy is showing signs of life that contrast with the torpor of recent years. High-frequency indicators point to continued momentum in industry and agriculture, with large-scale manufacturing up 4.1 percent year-over-year in the first quarter of fiscal year 2026, according to central bank data.
This manufacturing recovery is particularly notable given the sector’s struggles during the acute phase of Pakistan’s economic crisis. Industries ranging from textiles to automobiles are benefiting from improved power supply reliability, moderating input costs, and gradually recovering domestic demand.
The remittance story remains crucial. Worker remittances rose 17 percent year-over-year to $3.6 billion in December 2025, taking cumulative inflows in the first half of fiscal year 2026 to $19.7 billion, up 11 percent year-over-year. For an economy chronically short of foreign exchange, these inflows provide vital breathing room, supporting both the balance of payments and domestic consumption through transfers to households.
Yet headwinds persist. The State Bank reported a current account deficit of $244 million in December 2025, compared with surpluses of $454 million in December 2024 and $98 million in November 2025. While the deficit remains manageable within the projected 0-1 percent of GDP range, its reemergence after months of surplus warrants monitoring.
Sector Leadership: Banks, Energy, and Discovery
The composition of Pakistan’s equity rally reveals where investors see the most compelling opportunities. Banking stocks have been consistent leaders, benefiting from the prospect of lower funding costs, improving asset quality as the economy stabilizes, and the potential for credit growth resumption after years of contraction.
The energy sector, particularly oil and gas exploration companies, received a boost from recent discoveries. Hydrocarbon reserves were discovered in the TAL block, with expected production of 1.37 million cubic feet per day of gas. While not transformative in scale, such discoveries provide psychological lift to a sector that has long underperformed due to pricing disputes and regulatory uncertainty.
Pakistan Petroleum (PPL), Oil and Gas Development Company (OGDC), and Pakistan State Oil (PSO) have all participated in the rally, though for differing reasons. Exploration companies benefit from discovery potential and improving cash flows, while marketing companies like PSO gain from normalizing economic activity and reduced circular debt accumulation.
The fertilizer sector represents another area of strength, supported by government efforts to support agricultural production and moderating input costs, particularly natural gas pricing. Given agriculture’s central role in Pakistan’s economy and food security, policy support for this sector tends to be bipartisan and sustained.
The Historical Context: Unprecedented Territory
To fully appreciate the current rally’s magnitude, consider the historical perspective. The KSE-100 has previously reached all-time highs, with the index touching 170,719 points in earlier sessions. The current level of 188,621 represents a substantial advance beyond those previous peaks, taking the index into genuinely unprecedented territory.
The year-to-date performance is particularly striking. From January 5 to 9, the KSE-100 surged from 179,035 to 184,410, adding 5,375 points in a single week, according to Arif Habib Limited analysis. Such concentrated gains reflect both improving fundamentals and technical factors, including short-covering and momentum-based buying.
What distinguishes this rally from previous episodes is its foundation. Past bull markets in Pakistan often rested on fragile bases—temporary commodity windfalls, unsustainable fiscal expansions, or purely speculative fervor. The current advance, while certainly benefiting from momentum, appears anchored in more durable improvements: disinflation, external sector stability, and the resumption of economic activity after a brutal contraction.
Global Comparison: Pakistan’s Place in the Emerging Market Constellation
Pakistan’s equity performance becomes even more remarkable when viewed against the broader emerging market landscape. The year 2025 has been exceptional for emerging markets generally, with the MSCI Emerging Markets Index posting strong gains and outperforming developed markets.
The MSCI Emerging Markets Index has surged around 30 percent since the beginning of the year, outperforming all three major Wall Street averages. Within this cohort, certain markets have excelled. Greece’s Athens Composite has surged nearly 44 percent over the year and will be upgraded to developed market status in September 2026, while Chile and the Czech Republic’s benchmark indexes are both up around 50.8 percent year-to-date.
Pakistan’s 64 percent annual gain positions it among the top performers globally, though its frontier market classification and smaller free float mean it attracts less attention than larger emerging markets like India or Vietnam.
India, the regional giant, presents an interesting comparison. After a multi-year period of outperformance, Indian equities diverged from broader emerging market trends in 2025, entering a phase of consolidation. The Indian market’s valuation premium to other emerging markets had become stretched, prompting profit-taking even as the economic fundamentals remained solid.
Vietnam tells a different story. FTSE Russell announced in October 2025 that Vietnam will be upgraded from Frontier to Secondary Emerging Market status from September 21, 2026. The VN-Index rose from 1,100 points in April 2025 to nearly 1,700 points by October 2025, a 50 percent jump and a 33 percent year-to-date gain, making Vietnam the best-performing market in Southeast Asia.
Pakistan’s challenge is securing a similar reclassification. While its market has performed admirably, concerns about liquidity, governance, and regulatory predictability continue to keep it in the frontier category. Progress on these structural issues could unlock substantial passive inflows should international index providers upgrade Pakistan’s status.
The Dollar Dynamic: Currency as Catalyst
A crucial but often overlooked driver of emerging market performance in 2025-2026 has been the weakening U.S. dollar. One of the key catalysts for the continued strengthening of emerging market currencies and assets—U.S. dollar weakness—appears set to persist into the new year, according to VIG Asset Management analysis.
For Pakistan specifically, the Pakistani rupee strengthened slightly against the U.S. dollar, closing at 280.02 per dollar, up 0.03 percent week-over-week. While the magnitude of appreciation has been modest compared to some peers, the stabilization itself represents progress after years of serial devaluations that eroded purchasing power and investor confidence.
Currency stability creates multiple benefits for equity investors. It reduces the hedging costs for foreign investors, improves the predictability of earnings for companies with dollar-denominated debt, and signals macroeconomic competence to international audiences. For a country that has experienced repeated balance-of-payments crises, even modest currency strength carries outsize psychological weight.
Risks on the Horizon: What Could Derail the Rally
Prudent analysis demands acknowledging risks, and Pakistan’s rally faces several potential headwinds. The most immediate concerns fiscal slippage. Federal Board of Revenue collection slowed considerably to 10.2 percent year-over-year during July-November fiscal year 2026, implying significant acceleration required to achieve the budgeted tax collection target in the remaining seven months.
Tax revenue shortfalls create a familiar dilemma for Pakistani policymakers: either slash expenditures, potentially derailing growth, or accept higher deficits that risk triggering IMF concerns and currency pressure. The government’s ability to square this circle will be tested in coming months.
Foreign direct investment tells a sobering story. Net FDI stood at $808 million in the first six months of fiscal year 2025-26, down 43 percent year-over-year compared to $1,425 million in the same period last year. The country’s net FDI in December 2025 reported outflows of $135 million, with the largest outflow from Norway of $376 million in the IT sector due to Telenor’s exit from Pakistan following the sale of its assets to PTCL.
The FDI weakness reflects deeper structural issues: regulatory uncertainty, governance concerns, and the exit of multinational corporations that have concluded Pakistan’s market doesn’t justify the operational complexity. While portfolio inflows into equities have been strong, the absence of greenfield FDI limits Pakistan’s long-term growth potential and technological upgrading.
Geopolitical risks remain ever-present. Regional tensions, domestic political instability, and the perennial risk of security incidents all pose threats to investor confidence. Pakistan’s location in a volatile neighborhood means external shocks—from conflict escalation to border closures—can materialize with little warning.
Global factors matter as well. The global environment remains challenging, particularly for exports, which may have some implications for the macroeconomic outlook, the SBP noted. A global slowdown, particularly in key markets like China and the Gulf countries that absorb Pakistani exports, could undermine the current account trajectory.
The Valuation Question: Expensive or Just Getting Started?
For equity investors, the perennial question becomes whether Pakistan’s rally has run ahead of fundamentals or represents genuine value recognition. The KSE-100 currently trades at a price-to-earnings ratio of 9.2 times and offers a dividend yield of approximately 5.4 percent, according to analyst estimates.
These multiples appear modest relative to regional peers and global emerging markets, particularly given the earnings growth prospects. Yet valuations alone don’t determine market direction—sentiment, liquidity, and momentum frequently dominate in the short term.
The composition of buyers matters. Buying from local mutual funds, as reflected in recent flow data, played a key role in supporting the market’s upward trend. Domestic institutional participation provides a more stable foundation than purely retail-driven rallies, though it also means foreign investor participation remains limited relative to Pakistan’s market size.
For international investors, Pakistan presents a classic frontier market trade-off: exceptional returns potential balanced against liquidity constraints, governance uncertainty, and episodic volatility. The country lacks the institutional infrastructure and market depth of larger emerging markets, meaning position sizing must remain modest and exit liquidity cannot be taken for granted.
Forward Outlook: Momentum Versus Mean Reversion
As the January 26 Monetary Policy Committee meeting approaches, market attention will focus intensely on the magnitude of any rate cut and the accompanying forward guidance. A 50 basis point reduction is largely priced in; anything less could trigger profit-taking, while a larger cut might fuel further gains.
Beyond the immediate catalyst, Pakistan’s market trajectory depends on execution across multiple dimensions. Can the government close its fiscal gap without derailing growth? Will the current account remain manageable as imports recover? Can political stability be maintained through an election cycle? These questions will determine whether 2026 proves to be a continuation of 2025’s success or a return to familiar volatility.
The international context provides some tailwinds. Emerging market equities are positioned for robust performance in 2026, boosted by lower local interest rates, higher earnings growth, attractive valuations, ongoing improvements in corporate governance, healthier fiscal balance sheets and resilient global growth, according to J.P. Morgan Global Research.
For Pakistan to capture its share of emerging market flows, however, it must continue demonstrating policy credibility. The IMF program provides a framework, but sustained implementation matters more than announced intentions. Investors have heard promising narratives from Pakistani policymakers before; what distinguishes this cycle is the actual delivery on inflation reduction, reserve accumulation, and fiscal discipline.
Implications for Investors and Policymakers
For portfolio managers evaluating Pakistan, the opportunity set has clearly improved relative to the acute crisis years. The risk-reward proposition, while still tilted toward higher risk than established emerging markets, no longer appears as asymmetrically unfavorable as it did when reserves were perilously low and inflation was raging.
Tactical traders will focus on near-term catalysts: the January 26 rate decision, upcoming corporate earnings, and technical chart levels. Strategic investors might view Pakistan as a potential multi-year recovery play, betting that continued policy discipline could unlock a re-rating toward regional peer valuations.
For policymakers, the market’s strength creates both opportunities and responsibilities. Strong equity markets improve sentiment, facilitate capital raising for corporations, and can support wealth effects that boost consumption. Yet they also risk complacency—allowing market euphoria to substitute for the hard structural reforms that Pakistan desperately needs.
The agenda remains daunting: tax base expansion, energy sector reform, privatization of loss-making state enterprises, governance improvements in institutions ranging from power distribution to ports. These challenges won’t be solved by monetary easing or IMF programs alone. They require sustained political will, technical capacity, and societal consensus that have often proven elusive.
Conclusion: A Rally Grounded in Reality, Shadowed by Risks
Pakistan’s stock market surge past 188,600 points represents more than statistical milestone. It reflects a fundamental shift in the country’s macroeconomic trajectory—from crisis management to tentative normalization. The confluence of moderating inflation, improving reserves, and the prospect of further monetary easing has created conditions for equity appreciation that would have seemed implausible during the darkest days of 2023-2024.
Yet as Tuesday’s intraday volatility demonstrated, this remains a market where conviction and anxiety coexist. The path from frontier gamble to reliable emerging market investment requires more than favorable momentum—it demands institutional development, governance improvements, and sustained policy credibility that take years to build.
For now, Pakistan’s bourse continues to defy skeptics, posting returns that place it among the world’s top-performing markets. Whether this represents a durable re-rating or an ephemeral rally will be determined by execution on the structural challenges that have constrained Pakistan’s potential for decades. The central bank’s January 26 decision will provide the next chapter in this unfolding story.
Sources :
- Pakistan Stock Exchange Market Summary – Official PSX data and statistics
- KSE-100 Index Bloomberg Quote – Real-time index tracking
- State Bank of Pakistan Official Site – Monetary policy statements and economic data
- Trading Economics Pakistan Indicators – Comprehensive economic metrics
- MSCI Emerging Markets Analysis – Global EM context and comparisons


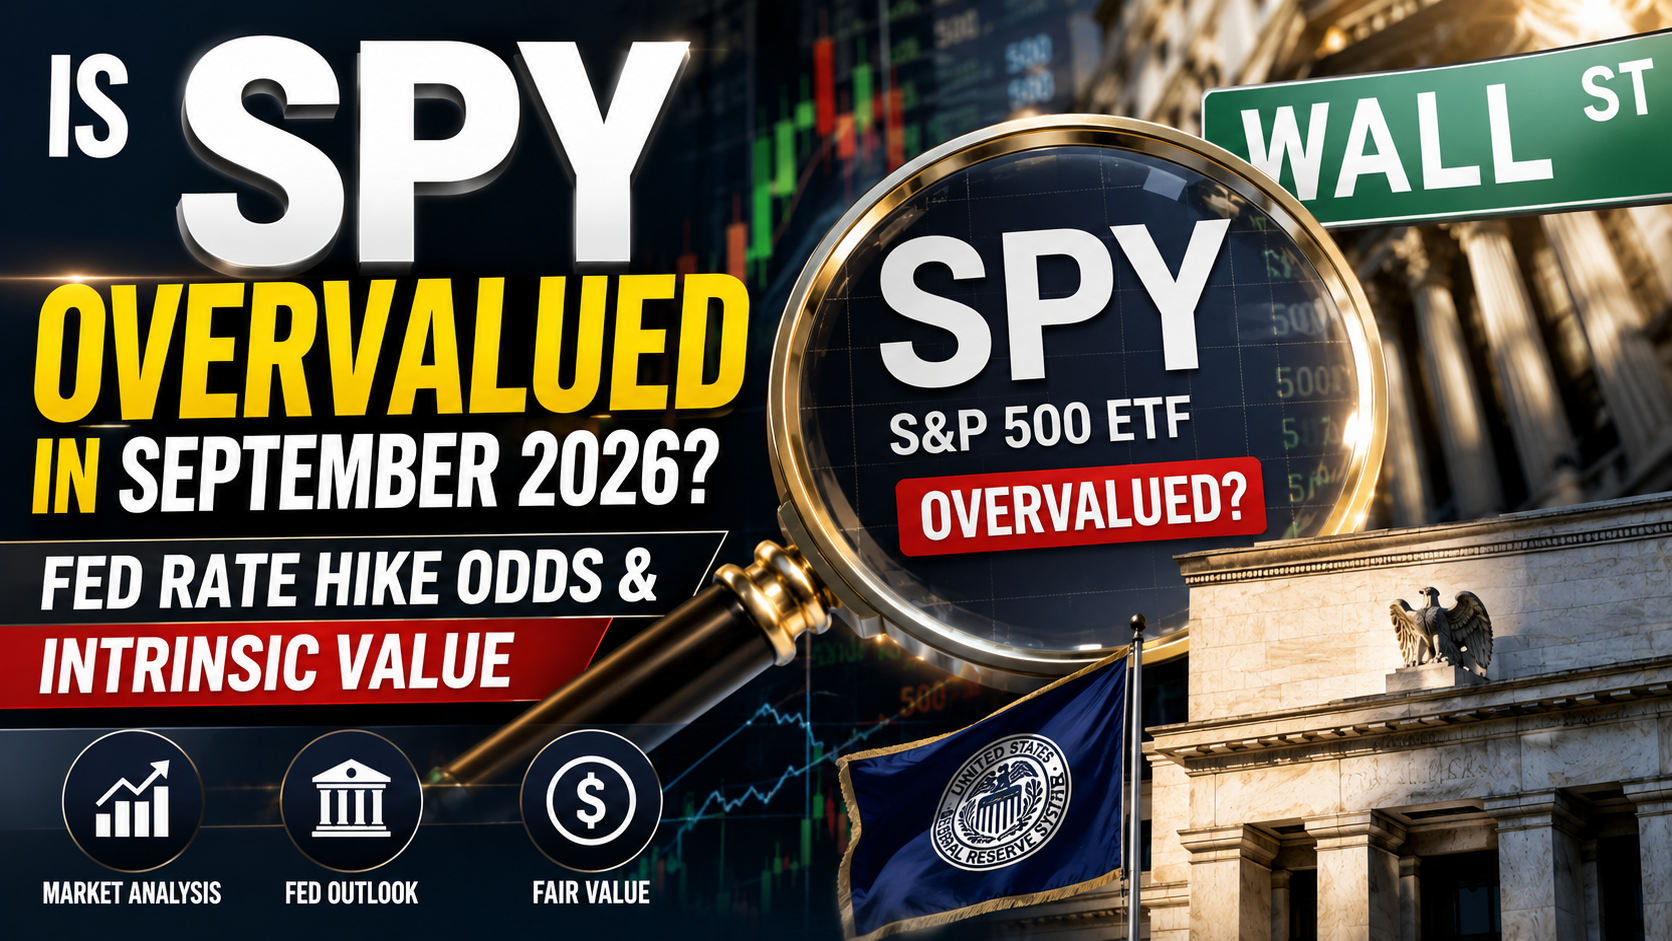
The SPDR S&P 500 ETF Trust (SPY) enters September 2026 trading around 7–14% above GuruFocus’s proprietary GF Value intrinsic-value estimate, depending on the week’s model inputs, with the index near record highs after an roughly 11–12% year-to-date gain. Unlike the rate-cut narrative that dominated markets earlier in the summer, the 10-year Treasury’s climb to 4.80% and hawkish Federal Reserve commentary now point toward markets pricing meaningful odds of a rate hike, not a cut, at this month’s FOMC meeting — a reversal that changes the valuation math for equities.
SPY Valuation Snapshot: Late August Into September 2026
| Date | SPY Price | GF Value™ (Intrinsic) | Overvaluation | GF Score™ | S&P 500 Level |
|---|---|---|---|---|---|
| Aug 6, 2026 | $768.31 | $685.35 | 12.1% | 85/100 | ~7,705 |
| Aug 10, 2026 | $773.26 | $702.96 | 10.0% | 86/100 | — |
| Aug 11, 2026 | $772.84 | $702.96 | 9.9% | 86/100 | — |
| Aug 17, 2026 | $776.34 | $705.76 | 10.0% | 86/100 | — |
| Aug 18, 2026 | $767.87 | $705.76 | 8.8% | 86/100 | — |
| Aug 19, 2026 | $769.45 | $705.76 | 9.0% | 86/100 | — |
| Aug 20, 2026 | $769.06 | $705.76 | 9.0% | 86/100 | — |
| Aug 25, 2026 | $765.67 | $715.63 | 7.0% | 86/100 | 7,665 (+11.4% YTD) |
| Aug 30, 2026 | $769.35 | $674.87 | 14.0% | 86/100 | — |
Note: GF Value estimates shift week to week as GuruFocus’s model incorporates new earnings, growth, and macro data — the fluctuation itself (from 7.0% to 14.0% overvalued within a single month) is a useful reminder that any single-day valuation snapshot is a moving target, not a fixed verdict.
| Rate/Bond Metric | Level (Sept 1, 2026) |
|---|---|
| 10-Year Treasury yield | 4.80% (highest since January 2025) |
| 30-Year Treasury yield | 5.28% |
| 2-Year Treasury yield | 4.39% |
| Market-implied odds of a Fed rate hike this month | ~68%, up from ~40% the prior week |
| SPY trailing P/E (TTM) | ~23.7x |
Sources: GuruFocus GF Value daily/weekly valuation notes (Aug 6–30, 2026); TradingEconomics, MacroMicro, and StreetStats Treasury yield data (Sept 1, 2026).
Deep Dive: A Valuation Picture Complicated by a Rate Story That Just Flipped
GF Value Says “Modestly to Meaningfully Overvalued,” But the Range Matters More Than Any Single Print
GuruFocus’s GF Value model — which blends historical trading multiples, business growth trends, and forward performance estimates into a single intrinsic-value estimate — has placed SPY anywhere from roughly 7% to 14% above fair value at various points across August 2026 alone. That’s not model inconsistency so much as it reflects genuinely volatile inputs: intrinsic value estimates move as new earnings data, Treasury yields, and macro releases feed the model, while the market price itself has been chopping in a roughly $765–$777 band.
The consistent signal across every reading, regardless of the exact overvaluation percentage: SPY’s GF Score — a composite of financial strength, profitability, growth, valuation, and momentum — has held steady in the 85–86 out of 100 range throughout the period. In plain terms, the model is saying the same thing every week: fundamentals underneath the index remain genuinely strong (profitability and growth sub-scores of 8/10), but the price paid for those fundamentals leaves a thin-to-negative margin of safety for new money entering at current levels.
The Bigger Story: The Fed Narrative Just Reversed
This is the detail most surface-level coverage of SPY valuation is missing entering September: the market’s rate-path assumption flipped over the course of late August. Earlier in the summer, a weak July jobs report and cooling CPI prints had markets leaning toward the possibility of rate cuts later in the year. By the final week of August, that had reversed. Fed Chair Warsh’s remarks at the Jackson Hole symposium reaffirmed a commitment to bringing inflation down, and Fed Governor Barr followed with comments that the central bank should be prepared to raise rates if inflation does not subside. The market reaction was immediate: odds of a 25-basis-point hike this month jumped from around 40% to roughly 68% within a single week, and the 10-year Treasury yield climbed for five consecutive sessions to reach 4.80% — its highest level since January 2025.
The proximate driver of the inflation concern is oil. Renewed geopolitical tensions have pushed crude prices higher, and rising energy costs are feeding directly into inflation expectations at a moment when the labor market — job openings edged higher in July, layoffs fell, and manufacturing expanded for an eighth straight month in August — is not showing the kind of softness that would normally take a hike off the table.
Why Rising Long-Term Yields Compress Equity Valuation Models
Every discounted-cash-flow-style valuation — including the general category of model GuruFocus’s GF Value falls into — is sensitive to the discount rate applied to future earnings. When the 10-year Treasury yield rises from a level closer to 4.3% (its trailing 12-month average) to a fresh cycle high of 4.80%, the “risk-free” comparison rate against which equity earnings yields are judged rises with it. All else equal, a higher discount rate lowers the intrinsic value estimate for the same stream of future earnings — which is part of why GF Value estimates for SPY have generally trended toward higher overvaluation readings as yields have climbed through August, even as the S&P 500 itself continued grinding higher.
The Seasonal Overlay: September’s Historical Track Record
Independent of valuation or rates, the calendar itself carries a well-documented pattern: the back half of September has historically been the weakest stretch of the trading year for the S&P 500, producing slightly negative average returns more often than any other multi-week period. That seasonal headwind, layered on top of a rate environment that just turned more hawkish and a valuation model flashing high-single to low-double-digit overvaluation, is the combination coverage of SPY heading into September 2026 should actually be weighing — not any single data point in isolation.
What a 23.7x Trailing P/E Actually Tells You
SPY’s trailing twelve-month P/E of approximately 23.7x sits meaningfully above long-run historical averages for the index (commonly cited in the high teens), though comparisons are complicated by the absence of a readily available 5-year median P/E in the underlying data used for this analysis — a data-availability gap GuruFocus itself has flagged in several of its own valuation notes. Investors should treat any single trailing-multiple comparison as one input among several (GF Value, GF Score, rate environment, seasonal pattern) rather than a standalone verdict.
Actionable Takeaways for Investors
- Don’t anchor to a single GF Value overvaluation percentage. The swing from 7.0% to 14.0% overvalued within the same month shows the model is sensitive to short-term inputs; look at the trend and the GF Score (steady at 85–86) together, not one week’s headline number.
- Track the 10-year Treasury yield as a leading valuation signal. A continued climb toward or past 4.80–5.00% would mechanically pressure equity valuation models further; a reversal back toward the 4.30% trailing average would ease that pressure.
- Reassess the “rate cut” assumption baked into your portfolio. If your equity allocation was built assuming Fed easing later in 2026, the shift toward hike odds of ~68% for this month’s meeting is a material change worth revisiting with a financial advisor.
- Respect September seasonality without overreacting to it. Historical weak-September patterns are a real, well-documented statistical tendency, not a guarantee — use it as a reason for disciplined position sizing rather than a market-timing signal on its own.
- Watch oil prices as the connective tissue between geopolitics, inflation, and equity valuation. The current inflation concern feeding into hike odds is substantially an energy-price story; a de-escalation in the geopolitical tensions driving crude higher would likely ease both bond yields and equity valuation pressure simultaneously.
Frequently Asked Questions
Is the S&P 500 overvalued right now? By GuruFocus’s GF Value metric, SPY has traded between roughly 7% and 14% above its estimated intrinsic value at various points across August 2026, with a GF Score of 85–86 out of 100 indicating strong underlying fundamentals despite the valuation premium — the honest answer is “modestly to meaningfully” overvalued depending on which week’s model reading you use, not overvalued by one fixed number.
Will the Federal Reserve raise or cut interest rates in September 2026? As of early September 2026, market pricing has shifted toward pricing in meaningful odds (around 68%) of a rate hike rather than a cut, reversing the rate-cut expectations that dominated earlier in the summer, driven by hawkish Fed commentary at Jackson Hole and rising oil-driven inflation concerns.
Why did the 10-year Treasury yield hit 4.80% in September 2026? The 10-year Treasury yield climbed for five consecutive sessions to reach 4.80% — its highest level since January 2025 — driven by rising oil prices amid renewed geopolitical tensions and hawkish signals from Federal Reserve officials suggesting a rate hike may be needed to control inflation.
How does September seasonality typically affect the S&P 500? Historically, the latter half of September has been the weakest multi-week stretch of the trading year for the S&P 500, often producing slightly negative average returns, though this is a statistical tendency rather than a reliable predictor for any specific year.
Analysis
FHS Saudi Arabia 2026 Opens in Riyadh, Drawing Investors Representing Nearly $5 Trillion in Assets
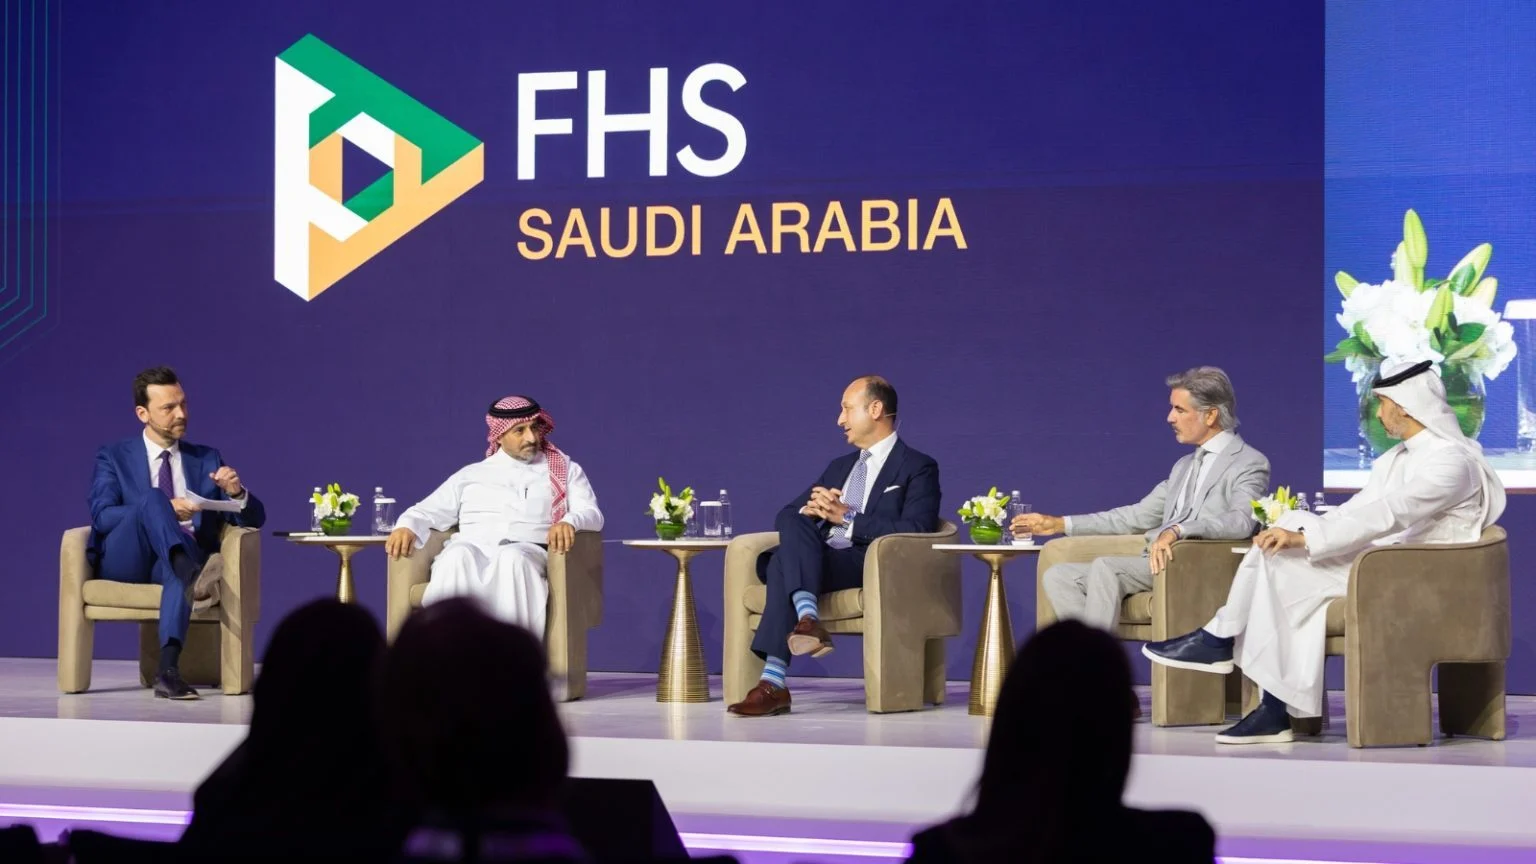
The Future Hospitality Summit (FHS) Saudi Arabia 2026 opens this week at the Mandarin Oriental Al Faisaliah in Riyadh, running June 22–24 and positioning itself as the Kingdom’s leading hospitality deal-making forum for the year. Organizers say attendees represent investors managing roughly $4.99 trillion in assets under management, underscoring the scale of capital now circling Saudi Arabia’s hospitality and tourism investment pipeline.
The timing is notable. The summit arrives even as the broader Middle East travel sector works through a difficult stretch — regional hotel occupancy and air capacity both fell sharply earlier in the year amid conflict-related disruption. Saudi Arabia’s hospitality investment push has continued largely undeterred, reflecting the Kingdom’s long-term tourism diversification strategy under Vision 2030, which has driven sustained hotel development, giga-project investment, and international brand expansion regardless of near-term regional volatility.
A Magnet for Global Capital
FHS Saudi Arabia has grown into one of the region’s most closely watched investment gatherings, bringing together hotel owners, operators, private equity investors, and sovereign capital to negotiate deals and discuss the Kingdom’s pipeline of new developments. The scale of capital represented by attendees — nearly $5 trillion — signals continued confidence among major institutional investors in Saudi Arabia’s hospitality growth story, even as some neighboring markets navigate near-term demand volatility.
Part of a Broader Investment Push
The summit’s opening coincides with a wider industry conversation about how governments can attract and retain private tourism investment. The World Travel & Tourism Council recently unveiled a seven-principle framework aimed at giving governments a practical roadmap — covering legal stability, fiscal incentives, and master planning — for courting exactly this kind of capital. Saudi Arabia’s continued ability to draw large-scale investor attendance to Riyadh suggests its approach is, for now, resonating with the institutional investment community.
What to Watch
Deal announcements, new hotel brand entries, and updates on giga-project hospitality components are expected to dominate headlines over the three-day event, with global hotel groups likely to use the summit to detail expansion plans across the Kingdom’s tourism corridors.
Investing 101
Gaming Giant’s Bold Gamble: Why Investors are Devouring Risky EA Debt Amid Geopolitical Crosscurrents
Investors are aggressively snapping up debt for Electronic Arts’ historic $55bn take-private, signaling resilient credit markets despite geopolitical tensions and AI disruption. Explore the EA LBO’s financial engineering, cost savings, and the appetite for risky video game financing in 2026.
Introduction: The Unyielding Allure of High-Yield
The world of high finance rarely pauses for breath, even as geopolitical headwinds gather and technological disruption reshapes industries. Yet, the recent $55 billion take-private of video game titan Electronic Arts (EA) has delivered a masterclass in market resilience, demonstrating an almost insatiable investor appetite for leveraged debt—even when tied to a complex, globally-infused transaction. Led by Saudi Arabia’s Public Investment Fund (PIF), Silver Lake, and Affinity Partners, this landmark deal, poised to redefine the gaming M&A landscape, has seen its $18-20 billion debt package met with overwhelming demand, proving that the pursuit of yield often eclipses lingering doubts.
This isn’t merely another private equity mega-deal; it’s a bellwether for global credit markets in early 2026. JPMorgan-led bond deals, designed to finance one of the largest leveraged buyouts in history, have drawn over $25 billion in orders, far surpassing their target size. This aggressive investor embrace of what many consider risky debt, particularly given the backdrop of Middle East tensions and concerns over AI’s impact on software, underscores a fascinating dichotomy: a cautious macroeconomic outlook juxtaposed with an audacious hunt for returns in stable, cash-generative assets. The question isn’t just how this was financed, but why investors dove in with such conviction, and what it signals for the year ahead.
The Anatomy of a Mega-Buyout: EA’s Financial Engineering
At an enterprise value of approximately $55 billion, the Electronic Arts take-private deal stands as the largest leveraged buyout on record, eclipsing the 2007 TXU Energy privatization. The financing structure is a finely tuned orchestration of equity and debt, designed to maximize returns for the acquiring consortium while appealing to a broad spectrum of debt investors.
Equity & Debt Breakdown
The EA $55bn LBO is funded through a combination of substantial equity and a significant debt tranche:
- Equity Component: Approximately $36 billion, largely comprising cash contributions from the consortium partners, including the rollover of PIF’s existing 9.9% stake in EA. PIF is set to own a substantial majority, approximately 93.4%, with Silver Lake holding 5.5% and Affinity Partners 1.1%.
- Debt Package: A substantial $18-20 billion debt package, fully committed by a JPMorgan-led syndicate of banks. This makes it the largest LBO debt financing post-Global Financial Crisis.
Unpacking the Debt Tranches: Demand & Pricing
The sheer scale of demand for this EA acquisition financing has been striking. The initial $18 billion debt offering, which included both secured and unsecured tranches, quickly swelled to over $25 billion in investor orders. This oversubscription highlights a strong market appetite for gaming-backed paper.
Key components of the debt include:
- Leveraged Loans: A cross-border loan deal totaling $5.75 billion launched on March 16, 2026, comprising a $4 billion U.S. dollar loan and a €1.531 billion ($1.75 billion) euro tranche.
- Pricing: Term Loan Bs (TLBs) were guided at 350-375 basis points over SOFR/Euribor, with a 0% floor and a 98.5 Original Issue Discount (OID). This discounted pricing suggests lenders were baking in some risk, yet the demand remained robust.
- Secured & Unsecured Bonds: The financing also features an upsized $3.25 billion term loan A, an additional $6.5 billion of other dollar and euro secured debt, and $2.5 billion of unsecured debt. While specific high-yield bond pricing hasn’t been detailed, market intelligence suggests secured debt at approximately 6.25-7.25% and unsecured north of 8.75%, reflective of the leverage profile.
The Deleveraging Path: Justifying a 6x+ Debt/EBITDA
Moody’s projects that EA’s gross debt will increase twelve-fold from $1.5 billion, pushing pro forma leverage (total debt to EBITDA) to around eight times at closing. Such high leverage ratios typically raise red flags, but the consortium’s pitch centers on EA’s robust cash flows and significant projected cost savings.
Three Pillars Justifying the Leverage
- Stable Cash Flows from Core Franchises: EA boasts an enviable portfolio of consistently profitable franchises, including FIFA (now EA Sports FC), Madden NFL, Apex Legends, and The Sims. These titles generate predictable, recurring revenue streams, particularly through live service models and annual updates, which underpin the company’s financial stability—a critical factor for debt investors.
- Strategic Cost Savings & Operational Efficiencies: The new owners have outlined an aggressive plan for $700 million in projected annual cost savings. This includes:
- R&D Optimization: $263 million from reclassifying R&D expenses for major titles like Battlefield 6 and Skate as one-time costs, now that they are live and generating revenue.
- Portfolio Review: $100 million from a strategic review of the game portfolio.
- AI Tool Integration: $100 million from leveraging AI tools for development and operations.
- Organizational Streamlining: $170 million from broader organizational efficiencies.
- Public Company Cost Removal: $30 million saved by no longer incurring costs associated with being a public entity.
These add-backs significantly bolster adjusted EBITDA figures, making the debt package appear more manageable to prospective lenders. Moody’s expects leverage to decrease to five times by 2029.
- Untapped Growth Potential in Private Ownership: Freed from quarterly earnings pressure, EA’s management can pursue longer-term strategic initiatives and R&D without the immediate scrutiny of public markets. This is particularly appealing for a company operating in an industry prone to rapid innovation and large, multi-year development cycles. The consortium’s diverse networks across gaming, entertainment, and sports are expected to create opportunities to “blend physical and digital experiences, enhance fan engagement, and drive growth on a global stage”.
Geopolitical Currents and the Appetite for Risky Debt
The influx of capital into the Electronic Arts bond deals is particularly noteworthy given the complex geopolitical backdrop of early 2026. Global markets are navigating sustained tensions in the Middle East, the specter of trade tariffs, and the disruptive force of artificial intelligence. Yet, these factors have not deterred investors from snapping up debt to finance Electronic Arts’ $55bn take-private.
The Saudi PIF Factor: Geopolitical Implications
The prominent role of Saudi Arabia’s Public Investment Fund (PIF) as the lead equity investor introduces a significant geopolitical dimension. The PIF, managing over $925 billion in assets, views this acquisition as a strategic move to establish Saudi Arabia as a global hub for games and sports, aligning with its “Vision 2030” diversification efforts. PIF’s deep pockets and long-term investment horizon offer stability often attractive to private equity deals.
However, the involvement of a sovereign wealth fund, particularly one with ties to Jared Kushner’s Affinity Partners, has not been without scrutiny. Concerns about national security risks, foreign access to consumer data, and control over American technology (including AI) have been voiced by organizations like the Communications Workers of America (CWA), who urged federal regulators to scrutinize the deal. Despite these geopolitical and regulatory considerations, the debt market demonstrated a remarkable willingness to participate. This indicates that the perceived financial stability and growth prospects of EA outweighed concerns tied to the source of equity capital.
AI Disruption and Market Confidence
The gaming industry, like many sectors, faces potential disruption from AI. Yet, EA itself projects $100 million in cost savings from AI tools, signaling a strategic embrace rather than fear of the technology. This forward-looking approach to AI, coupled with the inherent stability of established gaming franchises, likely contributed to investor confidence. In a volatile environment, proven entertainment IP acts as a relatively safe harbor.
The successful placement of this jumbo financing also suggests that while some sectors (like software) have seen “broader risk-off sentiment” due to AI uncertainty, the market distinguishes between general software and robust, content-driven interactive entertainment.
Broader Implications for Gaming M&A and Private Equity
The EA LBO is more than an isolated transaction; it’s a powerful signal for the broader M&A landscape and the future of private equity.
A Return to Mega-LBOs?
After a period where massive leveraged buyouts fell out of favor post-Global Financial Crisis, the EA deal marks a definitive comeback. It “waves the green flag on sponsors resuming mega-deal transactions,” indicating that easing borrowing costs and renewed boardroom confidence are aligning to facilitate large-cap M&A. The success of this deal, especially the oversubscription of its debt tranches, could embolden other private equity firms to pursue similar-sized targets in industries with reliable cash flows. This is crucial for private-equity debt appetite in 2026.
Creative Independence Post-Delisting
While private ownership offers freedom from public market pressures, it also introduces questions about creative independence. Historically, private equity has been associated with aggressive cost-cutting and a focus on short-term profits. For a creative industry like gaming, this can be a double-edged sword. While the stated goal is to “accelerate innovation and growth”, some within EA have expressed concern about potential workforce reductions and increased monetization post-acquisition. The challenge for the new owners will be to balance financial optimization with the nurturing of creative talent and IP development crucial for long-term success.
What it Means for 2027: Scenarios and Ripple Effects
As the EA $55bn take-private moves towards its expected close in Q1 FY27 (June 2026), its ripple effects will be closely watched by analysts and investors alike.
- Post-Deal EA Strategy: Under private ownership, expect EA to double down on its most successful franchises and potentially explore new growth vectors less scrutinized by quarterly reports. Strategic investments in areas like mobile gaming, esports, and potentially new IP development could accelerate. The projected cost savings will likely be reinvested to fuel growth or rapidly deleverage.
- Valuation Multiples: The deal itself sets a new benchmark for valuations in the gaming sector, particularly for companies with strong IP and predictable revenue streams. This could influence future M&A activities involving peers like Activision Blizzard (though now part of Microsoft) or Take-Two Interactive, raising their perceived floor valuations.
- Credit Market Confidence: The overwhelming investor demand for EA’s debt signals a powerful confidence in the leveraged finance markets, particularly for well-understood, resilient businesses. If EA successfully executes its deleveraging and growth strategy post-buyout, it will further validate the market’s willingness to finance large, complex LBOs, even amidst global uncertainty. This could pave the way for more “risky debt” deals tied to stable, high-quality assets.
- Geopolitical Influence in Tech: The PIF’s leading role solidifies the trend of sovereign wealth funds actively participating in global technology and entertainment sectors. This influence will continue to shape discussions around regulatory oversight, national interests, and the evolving landscape of global capital flows.
The investors snapping up debt to finance Electronic Arts’ $55bn take-private aren’t just betting on a video game company; they’re wagering on the enduring power of stable cash flows, strategic cost management, and a robust credit market willing to absorb risk for attractive yields. In a world grappling with uncertainty, the virtual battlefields of EA’s franchises offer a surprisingly solid ground for real-world financial gains.

Business Insurance for Digital Exports: Protecting Your Company in the AI Era

Real Estate Crash Predictions 2026: Data-Backed Regional Guide

What is a “Lead-Left” Bank? Unpacking Morgan Stanley’s Role in Anthropic’s Mega-IPO

Is SPY Overvalued in September 2026? Fed Rate Hike Odds & Intrinsic Value

Pakistan’s KSE-100 Nears Record Territory Even as the Trade Gap Persists

US Consumer Sentiment Sinks as Retail Sales Drop

Barclays Q2 2026 Results: Income Beats, Costs Rise 7%

Pakistan’s Remittance Lifeline: Why Gulf Exposure Is a Hidden Risk

Dubai’s Rise to the World’s 7th Financial Hub: Inside the D33 Push

China EV Exports Hit Record High in 2026

UK’s “National Contributions Tax” Explained: Burnham-Era Reform 2026

Russia’s Strange Problem in 2026: Its Currency Is Too Strong

Section 301 Forced Labor Tariffs 2026: 60 Countries Affected

UK National Contributions Tax: Burnham’s Radical Tax Plan

Top 15 Stocks for Investment in 2026 in PSX: Your Complete Guide to Pakistan’s Best Investment Opportunities
Top 15 Stocks for Investment in 2026 in PSX: Your Complete Guide to Pakistan’s Best Investment Opportunities

Debunking IMF Program Myths: Reconfiguring Engagement for True National Ownership in a Volatile World

Top 10 Mutual Fund Managers in Pakistan for Investment in 2026: A Comprehensive Guide for Optimal Returns

What the U.S. Attack on Venezuela Could Mean for Oil and Canadian Crude Exports: The Economic Impact

China’s 50% Domestic Equipment Rule: The Semiconductor Mandate Reshaping Global Tech

15 Most Lucrative Sectors for Investment in Pakistan: A 2025 Data-Driven Analysis

Pakistan’s Export Goldmine: 10 Game-Changing Markets Where Pakistani Businesses Are Winning Big in 2025
15 Most Lucrative Sectors for Investment in Pakistan: A 2025 Data-Driven Analysis
15 Most Lucrative Sectors for Investment in Pakistan: A 2025 Data-Driven Analysis

Pakistan’s Stock Market Renaissance: How 2025’s Hottest Investment Opportunity Is Democratizing Wealth—A Complete Beginner’s Guide

Pakistan’s Economic Outlook 2025: Between Stabilization and the Shadow of Stagnation
Pakistan’s Economic Outlook 2025: Between Stabilization and the Shadow of Stagnation

China’s Property Woes Could Last Until 2030—Despite Beijing’s Best Censorship Efforts
-
 Markets & Finance8 months ago
Top 15 Stocks for Investment in 2026 in PSX: Your Complete Guide to Pakistan’s Best Investment Opportunities
-
Markets & Finance8 months ago
Top 15 Stocks for Investment in 2026 in PSX: Your Complete Guide to Pakistan’s Best Investment Opportunities
-
 Analysis7 months ago
Debunking IMF Program Myths: Reconfiguring Engagement for True National Ownership in a Volatile World
-
 Investment8 months ago
Top 10 Mutual Fund Managers in Pakistan for Investment in 2026: A Comprehensive Guide for Optimal Returns
-
 Global Economy8 months ago
What the U.S. Attack on Venezuela Could Mean for Oil and Canadian Crude Exports: The Economic Impact
-
 Asia8 months ago
China’s 50% Domestic Equipment Rule: The Semiconductor Mandate Reshaping Global Tech
-
 AI9 months ago
15 Most Lucrative Sectors for Investment in Pakistan: A 2025 Data-Driven Analysis
-
 Exports9 months ago
Pakistan’s Export Goldmine: 10 Game-Changing Markets Where Pakistani Businesses Are Winning Big in 2025