
Analysis
Trump’s 2025-2026 Tariffs on Asia and Europe: Justified Protectionism or Self-Inflicted Economic Wound?

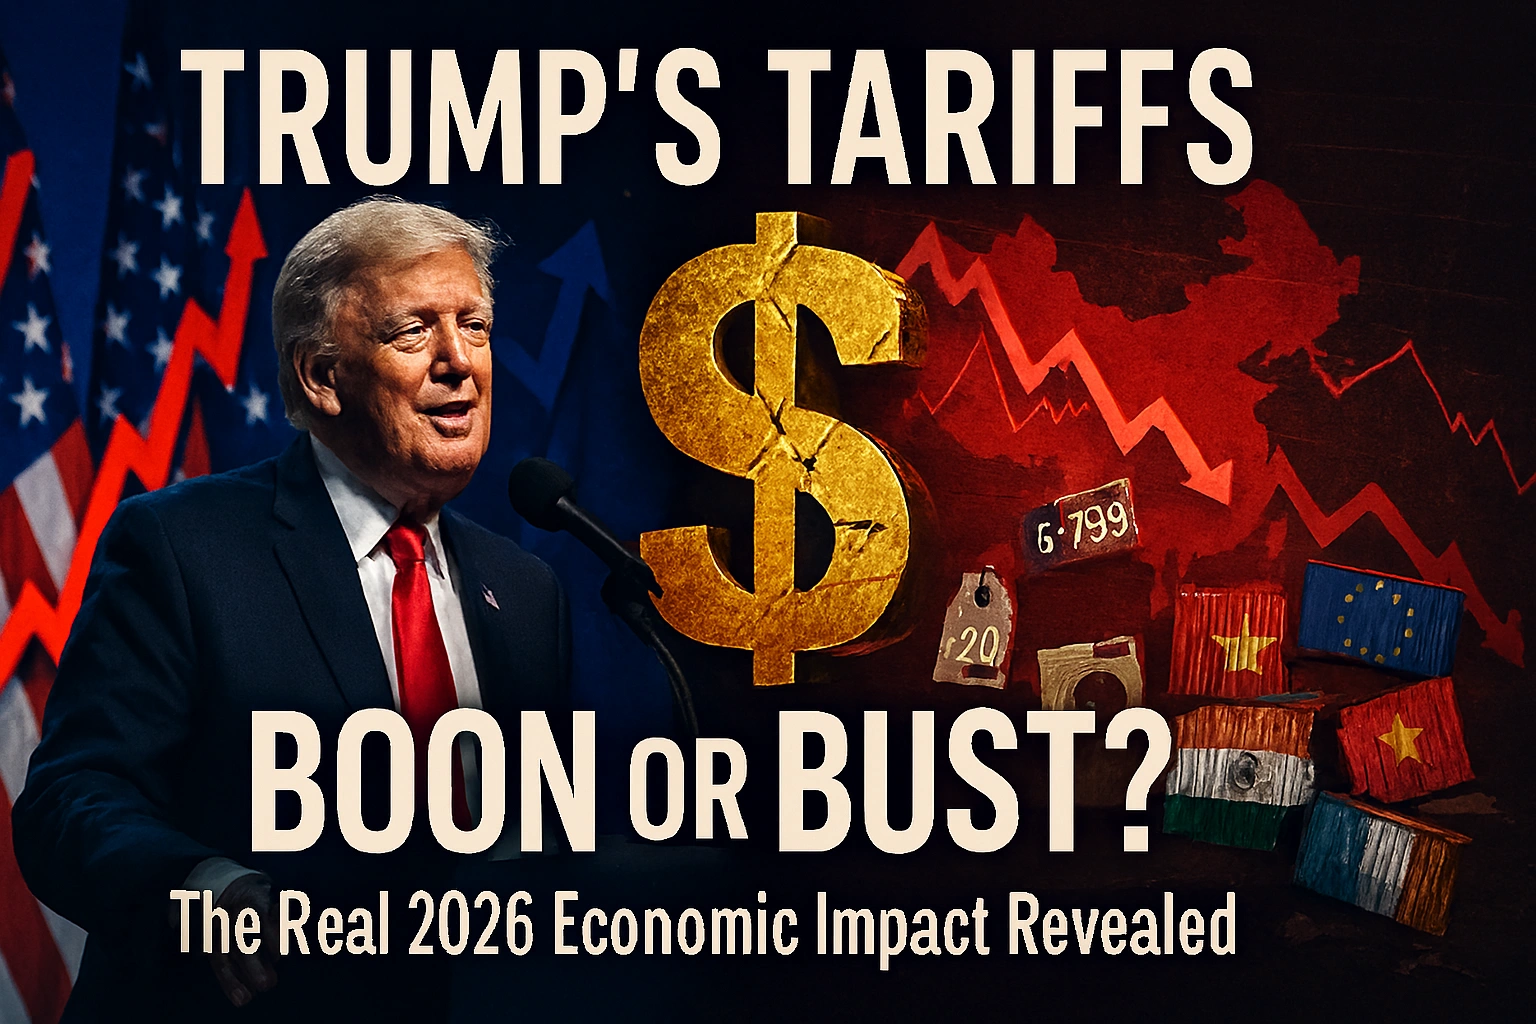
On a frigid January morning in Cincinnati, Sarah Chen stands in the aisles of her family’s small electronics shop, calculator in hand, recalculating profit margins for the third time this quarter. The wholesale price of the Chinese-made tablets that once flew off her shelves has jumped 34% since spring 2025. “I either absorb the hit or pass it to customers who are already stretched thin,” she tells me, her frustration palpable. “Either way, I lose.” Three thousand miles away, in a gleaming Tesla factory outside Austin, workers celebrate a modest expansion—twenty new jobs assembling battery components that once came exclusively from South Korea, now partially sourced domestically to sidestep tariff costs. Two stories, one policy: President Trump’s sweeping 2025-2026 tariff regime, the most aggressive protectionist turn in American trade policy since the Smoot-Hawley era.
Nearly two years into Trump’s second-term trade war, the economic verdict remains deeply contested. The administration points to $287 billion in tariff revenue collected in 2025—a dramatic increase from pre-2025 levels—and argues that reciprocal tariffs are finally leveling a playing field long tilted against American workers. Critics counter with mounting evidence of inflationary pressures, widening trade deficits, and minimal manufacturing gains that suggest the cure may be worse than the disease. As we approach the midpoint of 2026, the fundamental question persists: Are Trump’s tariffs justified protectionism reclaiming economic sovereignty, or a self-inflicted wound bleeding American consumers and competitiveness?
The Architecture of Trump’s Trade Offensive
The current tariff structure represents an unprecedented escalation in postwar American trade policy. Beginning in early 2025, the Trump administration implemented a multi-tiered system: a universal baseline tariff of 10-20% on virtually all imports, elevated rates of 60-125% on Chinese goods, and targeted duties of 25-50% on European automobiles, steel, and select agricultural products. The average effective U.S. tariff rate—hovering around 2.5% for decades—rocketed to approximately 27% by late 2025, according to Peterson Institute for International Economics analysis.
The stated rationale rests on three pillars. First, reciprocity: matching trading partners’ tariff levels to force negotiations toward lower barriers globally. Second, revenue generation: using import duties to offset income tax cuts and fund domestic priorities. Third, industrial policy: reshoring critical supply chains in semiconductors, pharmaceuticals, and defense materials deemed vital to national security. In Trump’s framing, decades of “unfair” trade deals hollowed out the Rust Belt, enriched China, and left America dangerously dependent on adversaries for essential goods.
There’s historical precedent for this worldview. Alexander Hamilton championed tariffs to nurture infant American industries. The post-Civil War “American System” used protectionism to fuel industrialization. Even modern economic giants like South Korea and Japan deployed strategic tariffs during development. The question isn’t whether protectionism can ever work—it’s whether Trump’s specific implementation, in today’s deeply integrated global economy, achieves its goals without prohibitive costs.
Revenue Gains: Real but Misleading
The Trump administration’s headline achievement is undeniable: tariff revenue surged to $287 billion in 2025, compared to roughly $80 billion annually in the pre-Trump era. Treasury Secretary Scott Bessent hailed this as vindication, arguing tariffs function as a “consumption tax on foreign goods” that funds government without burdening American workers.
Yet this framing obscures crucial economic reality. Unlike income taxes paid by high earners, tariffs function as regressive consumption taxes. When importers pay the tariff at the border, those costs cascade through supply chains, ultimately landing on retail prices. A Brookings Institution study estimated that Trump’s 2025 tariffs cost the average American household between $1,800 and $2,400 annually through higher prices on everything from smartphones to sneakers to strawberries. Low-income families, who spend proportionally more on goods than services, bear the heaviest burden.
Moreover, tariff revenue must be weighed against offsetting economic drags:
- Reduced import volumes: As prices rise, Americans buy fewer foreign goods, eventually shrinking the tariff base itself
- Retaliation costs: European Union and Chinese counter-tariffs hammered U.S. agricultural exports, requiring $12 billion in emergency farm aid in 2025
- Productivity losses: Inefficient domestic production substituting for cheaper foreign goods reduces overall economic output
- Administrative burden: Customs enforcement, trade dispute litigation, and exemption processes consume billions annually
When accounting for these factors, Yale Budget Lab economists calculate that each dollar of tariff revenue corresponds to $1.80 in total economic cost—hardly the free lunch portrayed.
The Manufacturing Renaissance That Wasn’t
Perhaps the most politically salient promise of Trump’s tariff regime was a renaissance in American manufacturing—factories returning from Shenzhen and Stuttgart, blue-collar jobs reviving the Midwest. The empirical record shows modest gains at best, illusions at worst.
U.S. manufacturing employment did tick upward in 2025, adding approximately 140,000 jobs according to Bureau of Labor Statistics data. Specific sectors saw notable activity: semiconductor fabrication plants broke ground in Arizona and Ohio, battery component production expanded in Michigan, and some textile operations relocated from Vietnam to North Carolina. The administration trumpets these wins as proof of concept.
Dig deeper, however, and the picture complicates. Federal Reserve analysis reveals that many “reshored” jobs represent capital-intensive automation rather than labor-intensive production. A chip fab employing 800 engineers and technicians replaces a Chinese factory employing 15,000 assembly workers—beneficial for high-skilled employment, but not the working-class bonanza promised. Meanwhile, manufacturing output as a percentage of GDP remained essentially flat in 2025, suggesting production gains merely kept pace with overall economic growth rather than outperforming.
More troubling, supply chains proved far more complex than tariff architects anticipated. Rather than returning to the U.S., many manufacturers simply rerouted through third countries to evade duties—China ships steel through Mexico, electronics route via Malaysia, pharmaceuticals detour through India. World Bank trade flow data documents this “trade deflection” phenomenon, which preserves Chinese production while generating paperwork, transportation costs, and environmental waste without yielding American jobs.
The hardest-hit were small and medium manufacturers dependent on imported components. A Michigan auto parts supplier I spoke with last fall described the squeeze: “We import specialized steel from Germany because no American mill produces it. The 40% tariff tripled our costs overnight. We laid off twelve people and cancelled our expansion.” For every factory celebrating tariff protection, another curses tariff-induced input costs.
Consumer Costs and Inflation’s Quiet Bite
The most direct economic impact of Trump’s tariffs landed at checkout counters nationwide. While headline inflation moderated from 2022-2023 peaks, consumer price data reveals tariff-specific spikes in key categories throughout 2025:
- Electronics: Laptops, smartphones, and televisions rose 12-18% on average, disproportionately affecting middle-class families and students
- Apparel and footwear: Clothing prices increased 8-11%, hitting budget-conscious shoppers hardest
- Automobiles: Both imported and domestic vehicles jumped 6-9% as automakers passed through tariff costs and faced reduced foreign competition
- Home appliances: Washing machines, refrigerators, and HVAC systems climbed 7-13%, devastating first-time homebuyers
Research from the National Bureau of Economic Research quantified the phenomenon: for every percentage point increase in effective tariff rates, consumer prices rise approximately 0.3 percentage points within 12-18 months. Applied to Trump’s 24-point tariff increase (from ~3% to ~27%), the model predicts a 7-point inflationary contribution—precisely what Federal Reserve economists privately estimate, according to sources familiar with internal models.
The Federal Reserve faced an impossible bind. Raising interest rates to combat tariff-driven inflation would choke economic growth and employment. Accommodating higher prices would erode purchasing power and risk unanchored expectations. Chairman Jerome Powell’s carefully parsed statements throughout 2025 reflected this dilemma: acknowledging “supply-side price pressures from trade policy” while maintaining data-dependent gradualism.
For millions of Americans like Sarah Chen in Cincinnati, macroeconomic abstractions translate to lived hardship. Tariffs don’t feel like abstract policy—they feel like shrinking purchasing power, deferred family vacations, and anxiety about making ends meet.
Asia’s Response: Adaptation and Defiance
China’s reaction to Trump’s tariff offensive underscored the limits of unilateral trade pressure. Rather than capitulating to U.S. demands, Beijing doubled down on industrial strategy and supply chain resilience. Chinese customs data revealed a record $1.2 trillion trade surplus in 2025—up from $823 billion in 2024—driven by surging exports to Europe, Southeast Asia, and Africa that offset declining U.S. sales.
The Communist Party framed Trump’s tariffs as vindication of Xi Jinping’s “dual circulation” strategy: reducing dependence on Western markets while dominating critical technology supply chains. Massive subsidies flowed to electric vehicles, solar panels, and advanced semiconductors, flooding global markets and undercutting both American and European competitors. The European Union, initially sympathetic to U.S. complaints about Chinese overcapacity, found itself imposing its own duties on Chinese EVs to protect nascent industries—fragmenting rather than unifying the Western response.
Meanwhile, Southeast Asian economies emerged as clear winners. Vietnam, Thailand, and Malaysia attracted factories fleeing both Chinese tariffs and rising Chinese labor costs, positioning themselves as neutral intermediaries in the U.S.-China rivalry. The ASEAN bloc’s combined exports to the U.S. jumped 23% in 2025, with Vietnamese electronics and Thai auto parts capturing market share. Ironically, Trump’s tariffs accelerated precisely the regional supply chain diversification China had resisted for years—but without returning production to American soil.
Japan and South Korea navigated cautiously, securing partial tariff exemptions through bilateral negotiations while deepening technological partnerships with China despite U.S. pressure. The administration’s transactional approach—threatening allies with tariffs, then granting reprieves in exchange for concessions—bred resentment even among traditional partners. Seoul’s decision to join China’s Regional Comprehensive Economic Partnership framework in late 2025, after decades of resistance, signaled eroding American influence.
Europe’s Dilemma: Retaliation and Recession Fears
Transatlantic relations, already strained over climate policy and defense spending, deteriorated sharply under Trump’s tariff regime. The European Union, facing 25-50% duties on automobiles, machinery, and luxury goods, retaliated with €48 billion in counter-tariffs targeting politically sensitive American exports: Kentucky bourbon, Florida orange juice, Iowa pork, California wine, and Harley-Davidson motorcycles.
The economic damage proved mutual. German automakers BMW, Volkswagen, and Mercedes-Benz—major employers in South Carolina, Alabama, and Georgia—cut U.S. production plans, citing tariff uncertainty and retaliatory costs. French luxury conglomerate LVMH postponed a Texas expansion. Italian food exporters scrambled to find alternatives to the lucrative American market. The International Monetary Fund downgraded eurozone growth forecasts by 0.4 percentage points for 2026, attributing half the revision to U.S. trade disruptions.
Yet Europe’s response also revealed deeper fractures. Hungary and Italy, led by populist governments sympathetic to Trump’s nationalism, resisted aggressive retaliation. France and Germany pushed for tougher measures to defend European industry. The disunity emboldened the Trump administration to negotiate bilaterally, offering Germany partial auto tariff relief in exchange for increased defense spending—undermining EU cohesion and empowering American divide-and-conquer tactics.
The strategic irony was profound: at the very moment Western democracies confronted authoritarian China’s economic coercion and Russia’s military aggression, Trump’s tariffs fractured the alliance that built the postwar liberal order. Brussels officials privately despaired that America’s turn inward left Europe geopolitically isolated and economically vulnerable—precisely the outcome Beijing and Moscow desired.
The Bigger Picture: Protection or Economic Drag?
Stepping back from sectoral details, what does the macroeconomic evidence reveal about Trump tariffs’ net impact? Three overarching conclusions emerge from academic research and institutional analysis:
First, costs substantially exceed benefits for the overall economy. The Tax Foundation’s comprehensive modeling estimates Trump’s 2025-2026 tariff regime will reduce long-run GDP by 0.7%, eliminate approximately 650,000 jobs across all sectors (even accounting for manufacturing gains), and decrease average household incomes by $2,100 annually. These aggregate losses swamp the gains to protected industries and tariff revenue collected.
Second, distributional effects are starkly regressive. While some manufacturing workers in specific sectors benefit through higher wages and job security, far more Americans lose through higher consumer prices, reduced employment in trade-dependent services, and diminished investment returns. The bottom income quintile bears 2.8 times the proportional burden of the top quintile, according to Congressional Budget Office incidence analysis—exacerbating inequality Trump claimed to remedy.
Third, geopolitical blowback undermines national security aims. Rather than compelling adversaries to change behavior, tariffs accelerated Chinese self-sufficiency, alienated European allies, and fragmented global supply chains in ways that reduce American leverage. The semiconductor supply chain, ostensibly protected for national security, grew more vulnerable as Asian partners hedged against U.S. reliability and Chinese competitors received massive state support to catch up technologically.
These findings align with historical experience. The Smoot-Hawley tariffs of 1930, enacted during the Great Depression to protect American jobs, instead deepened the crisis as trading partners retaliated and global commerce collapsed. The 2002 Bush steel tariffs, imposed to help struggling Rust Belt mills, cost 200,000 jobs in steel-consuming industries—more than the entire steel sector employed—and were withdrawn after 20 months. Trump’s own first-term washing machine tariffs raised consumer prices by $1.5 billion annually while creating just 1,800 jobs—a cost of $817,000 per job.
The pattern holds: protectionism delivers concentrated, visible benefits to politically powerful industries while imposing diffuse, invisible costs on consumers and downstream businesses. The benefits generate campaign contributions and photo ops at factory openings; the costs appear as slightly higher prices on ten thousand products, barely noticeable individually but devastating in aggregate.
A False Choice Between Sovereignty and Prosperity
The central flaw in Trump’s tariff logic is the premise that America must choose between economic openness and national strength. This false binary ignores the reality that American prosperity and security are deeply intertwined with global integration—not despite it, but because of it.
Consider the semiconductor industry, the crown jewel of strategic competition with China. American firms like Intel, Nvidia, and Qualcomm dominate chip design precisely because they access the world’s best talent (immigrant engineers), the world’s most efficient manufacturing (TSMC in Taiwan), and the world’s largest markets (global sales funding R&D). Tariff walls that fragment this ecosystem don’t strengthen American chips; they handicap innovation by raising costs and shrinking markets.
Or examine agriculture, where the U.S. enjoys genuine comparative advantage. American farmers are the world’s most productive, feeding hundreds of millions globally while supporting rural communities domestically. Chinese and European retaliatory tariffs, triggered by Trump’s trade war, cost U.S. agricultural exporters $27 billion in 2025—obliterating value that took decades to build. Taxpayer bailouts now sustain farmers who once competed profitably on merit.
The alternative to Trump’s blunt protectionism isn’t naive free trade absolutism. It’s smart industrial policy: targeted investments in R&D, infrastructure, and workforce training; strategic stockpiling of critical materials; alliance-based supply chain coordination; enforcement of trade rules against genuine cheating. South Korea didn’t become a semiconductor powerhouse through tariffs; it did so through decades of education investment, R&D subsidies, and export orientation. Germany maintains world-leading manufacturing not by closing borders, but through apprenticeship systems, stakeholder capitalism, and engineering excellence.
Conclusion: Counting the True Cost
As Sarah Chen in Cincinnati wrestles with another round of price increases, and the Austin factory worker celebrates marginal job growth, the fundamental question remains unresolved: Do Trump’s tariffs justify their economic pain?
The empirical record, now approaching two years, offers a sobering answer. Revenue gains are real but regressive. Manufacturing jobs increased modestly but fell far short of promises. Consumer costs mounted significantly. Trade deficits persisted and in some cases widened. Geopolitical isolation deepened. The macroeconomic models projecting net harm have proven distressingly accurate.
This doesn’t mean all protectionism is foolish or that America should passively accept unfair trade practices. Strategic tariffs can protect infant industries, counter dumping, or safeguard national security in genuinely critical sectors. The problem is Trump’s scattershot, maximalist approach: blanket tariffs on allies and adversaries alike, imposed without coordinated strategy, maintained despite mounting evidence of failure, justified through economic nationalism that mistakes autarky for strength.
The tragic irony is that legitimate concerns—Chinese overcapacity, supply chain vulnerabilities, working-class dislocation—get lost in the chaos of indiscriminate protectionism. By crying wolf with tariffs on European cheese and Canadian lumber, the administration undermines its own case for action on genuinely problematic Chinese subsidies or technology theft.
As voters contemplate America’s economic trajectory heading toward 2028, the tariff experiment offers a clear lesson: economic sovereignty isn’t achieved by raising walls, but by building ladders—investing in innovation, education, and infrastructure that make American workers the most productive on earth. Protection from competition breeds complacency; competition with support breeds excellence.
The choice isn’t between globalization and workers, between openness and security. It’s between smart policies that strengthen American competitiveness within global markets, and blunt instruments that inflict economic pain while claiming to protect us from the world. Two years of Trump’s tariffs suggest we’ve chosen poorly. The question now is whether we’ll learn from the evidence—or continue counting costs we can’t afford to pay.



The New Risk Frontier of Digital Exports
As software, AI models, digital media, and cross-border SaaS platforms dominate global trade, traditional commercial property and casualty insurance is no longer sufficient. Digital exporters face complex liabilities ranging from cross-border data privacy breaches and algorithmic bias claims to intellectual property infringement in foreign jurisdictions. In 2026, protecting a borderless digital enterprise requires specialized insurance coverage tailored to intangible asset risks.
Failing to secure robust digital export insurance can expose founders and shareholders to catastrophic lawsuits originating from overseas regulatory bodies.
Essential Coverages for Digital Export Enterprises
Cyber Liability and Algorithmic Error Coverage
If an AI model or software product exported overseas malfunctions or suffers a data breach, foreign regulators can levy severe fines under regional privacy laws. Modern cyber policies cover both regulatory defense costs and third-party damages.
Intellectual Property and Copyright Defense
Digital creators and SaaS firms operating globally are frequent targets of frivolous IP litigation in unfamiliar legal systems. Specialized IP insurance covers the exorbitant legal fees required to defend international patents and copyrights.
| Insurance Policy Type | Primary Protection Area | Target Enterprise | Average Annual Premium |
| Global Cyber Liability | Data breaches, ransomware, AI output errors | SaaS & AI Platforms | $5,000 – $18,000 |
| E&O Professional Liability | Service failures, missed deliverables | Digital Consultancies & Agencies | $3,000 – $10,000 |
| International IP Defense | Foreign copyright & patent lawsuits | Software Developers & Creators | $7,000 – $25,000 |
Securing Comprehensive Coverage: Best Practices
Navigating the insurance market for digital exports requires partnering with specialized brokers who understand intangible asset exposures.
Audit Geographic Exposures: Clearly map where your digital users reside to ensure your policy covers those specific regulatory jurisdictions.
Verify AI Exclusion Clauses: Carefully review policy wording to ensure your generative AI or automated tools are not explicitly excluded from coverage.
Maintain Incident Response Protocols: Insurers offer lower premiums to firms that demonstrate rigorous cybersecurity and data governance standards.
“Risk Management Expert Note: Your software may be intangible, but your liability in foreign markets is entirely real. Comprehensive digital export insurance is the ultimate shield for borderless growth.”
Equipping your digital export enterprise with specialized insurance safeguards your balance sheet and ensures uninterrupted global expansion.

If you’ve followed coverage of Anthropic’s reported IPO preparations, you’ve likely seen a specific phrase repeated across Financial Times and Bloomberg reporting: Morgan Stanley is said to hold the “pole position” for the lead-left role on the offering. It sounds like insider jargon — and it is — but understanding what it actually means reveals a lot about how the largest IPOs in history get priced, sold, and stabilized after they start trading.
Key Takeaways
- “Lead-left” refers to the underwriting bank listed first on the cover page of an IPO prospectus — traditionally positioned on the left side of the page.
- The lead-left bank runs the bookbuilding process, sets the final offer price alongside the issuer, and typically earns the largest share of underwriting fees.
- Morgan Stanley reportedly holds the inside track for this role on Anthropic’s IPO, with Goldman Sachs running “neck-and-neck” for a top-tier co-lead position.
- JPMorgan, Citigroup, and Barclays are expected to round out the broader underwriting syndicate.
- The same three lead banks — Morgan Stanley, Goldman Sachs, JPMorgan — ran the book on the SpaceX IPO in June 2026, the current record holder for largest offering ever.
- For investors, the lead-left bank’s decisions directly shape share allocation, pricing discipline, and after-market stability.
The Origin of the Term (and Why It Still Matters)
The “lead-left” designation dates back to a literal physical convention: on the cover page of a printed IPO prospectus, underwriting banks are listed in order of importance, with the most senior bank’s name and logo positioned on the far left. Over decades, “lead-left” became shorthand for the bank running point on the entire transaction — even as prospectuses moved from print to digital filings.
Today, being lead-left signals to the market that a bank has taken primary responsibility for:
- Bookbuilding — soliciting and aggregating orders from institutional investors during the roadshow
- Price discovery — synthesizing investor demand into a final offer price recommendation for the issuer’s board
- Fee allocation — typically claiming the largest cut of the total underwriting discount, often in the 20–40% range of total fees depending on syndicate structure
- Stabilization — managing after-market trading support, including exercising the “greenshoe” over-allotment option to buy back shares if the stock trades below the offer price shortly after listing
Why the Role Matters More in a Deal This Size
For a conventional mid-sized IPO, the lead-left designation is largely an internal Wall Street prestige marker. For a deal of Anthropic’s reported scale — targeting a valuation near $2 trillion, which would rival or exceed SpaceX’s record-setting June 2026 debut — the stakes are dramatically higher.
A misjudged offer price on a deal this large can produce two very different bad outcomes:
- Underpricing: If shares are priced too conservatively relative to demand, the company leaves substantial capital on the table, and early flippers capture gains that could have gone to the company’s own balance sheet.
- Overpricing: If shares are priced too aggressively, the stock can “break issue” — trading below its offer price shortly after listing — which damages investor confidence and can make it harder for the company to raise capital in follow-on offerings.
SpaceX’s own trajectory illustrates this tension well: shares priced at $135, reaching a first-day peak near a $2.1 trillion market cap, before settling into a range closer to $1.5 trillion by late July. Managing that kind of post-listing volatility responsibly falls disproportionately on the lead-left bank’s trading desk.
Morgan Stanley vs. Goldman Sachs: Why Both Are in the Running
Reporting indicates Morgan Stanley and Goldman Sachs are “running neck-and-neck” for top billing on Anthropic’s deal — a genuinely competitive situation rather than a formality. Both banks bring distinct strengths:
| Factor | Morgan Stanley | Goldman Sachs |
|---|---|---|
| Prior AI-sector IPO experience | Co-led SpaceX (June 2026) | Co-led SpaceX (June 2026) |
| Institutional distribution network | Extensive global wealth management arm | Deep institutional and sovereign wealth relationships |
| Existing Anthropic relationship | Reported prior debt financing role | Reported prior debt financing role |
| Technology sector banking franchise | Historically strong in large-cap tech | Historically strong in large-cap tech and growth equity |
In practice, mega-deals of this size increasingly use joint lead-left structures or closely shared top billing, which allows the issuer to tap both banks’ distribution networks without fully subordinating either one — a structure that may ultimately be how Anthropic’s deal resolves this specific competitive tension.
How This Connects to Anthropic’s Debt Financing
It’s not coincidental that the banks reportedly competing for Anthropic’s lead underwriting roles are the same institutions that previously provided the company debt financing, and are now reportedly structuring a $15 billion pre-IPO credit facility. This dual relationship gives whichever bank secures lead-left status unusually deep, pre-existing visibility into Anthropic’s financial position — audited or not — heading into the roadshow.
What Retail Investors Should Take Away From the Lead-Left Story
- It’s a signal of seriousness, not a valuation guarantee. A bank agreeing to lead a deal at a reported $2 trillion target valuation suggests institutional confidence in achievable demand — it does not certify that the price is fundamentally justified.
- It affects share allocation indirectly. Retail brokerage partnerships for IPO share access are often negotiated through relationships with the lead-left and co-lead banks, meaning which banks lead the deal can shape (modestly) which retail platforms get any allocation at all.
- It affects after-market behavior. The lead-left bank’s stabilization activity in the days following listing can meaningfully dampen (or fail to dampen) early volatility — worth watching closely if you plan to trade in the first week after listing rather than the IPO itself.
FAQ
What does “lead-left” mean in an IPO?
It refers to the underwriting bank listed first — traditionally on the left side — of an IPO prospectus cover page, signifying the bank with primary responsibility for pricing, bookbuilding, and after-market stabilization.
Is Morgan Stanley confirmed as Anthropic’s lead-left bank?
Not yet confirmed. Reporting from the Financial Times indicates Morgan Stanley holds the “pole position” for the role, with Goldman Sachs running closely for a top-tier position, but no final syndicate structure has been publicly confirmed by Anthropic.
Do lead-left banks make more money than other underwriters?
Generally yes. The lead-left bank typically receives the largest share of the total underwriting fee pool, reflecting its greater responsibility and risk in the bookbuilding and pricing process.
Does the lead-left bank guarantee a successful IPO?
No. A strong lead-left bank improves the odds of an orderly process and pricing discipline, but cannot guarantee post-listing stock performance, as SpaceX’s own valuation compression after its June 2026 debut illustrates.

The SPDR S&P 500 ETF Trust (SPY) enters September 2026 trading around 7–14% above GuruFocus’s proprietary GF Value intrinsic-value estimate, depending on the week’s model inputs, with the index near record highs after an roughly 11–12% year-to-date gain. Unlike the rate-cut narrative that dominated markets earlier in the summer, the 10-year Treasury’s climb to 4.80% and hawkish Federal Reserve commentary now point toward markets pricing meaningful odds of a rate hike, not a cut, at this month’s FOMC meeting — a reversal that changes the valuation math for equities.
SPY Valuation Snapshot: Late August Into September 2026
| Date | SPY Price | GF Value™ (Intrinsic) | Overvaluation | GF Score™ | S&P 500 Level |
|---|---|---|---|---|---|
| Aug 6, 2026 | $768.31 | $685.35 | 12.1% | 85/100 | ~7,705 |
| Aug 10, 2026 | $773.26 | $702.96 | 10.0% | 86/100 | — |
| Aug 11, 2026 | $772.84 | $702.96 | 9.9% | 86/100 | — |
| Aug 17, 2026 | $776.34 | $705.76 | 10.0% | 86/100 | — |
| Aug 18, 2026 | $767.87 | $705.76 | 8.8% | 86/100 | — |
| Aug 19, 2026 | $769.45 | $705.76 | 9.0% | 86/100 | — |
| Aug 20, 2026 | $769.06 | $705.76 | 9.0% | 86/100 | — |
| Aug 25, 2026 | $765.67 | $715.63 | 7.0% | 86/100 | 7,665 (+11.4% YTD) |
| Aug 30, 2026 | $769.35 | $674.87 | 14.0% | 86/100 | — |
Note: GF Value estimates shift week to week as GuruFocus’s model incorporates new earnings, growth, and macro data — the fluctuation itself (from 7.0% to 14.0% overvalued within a single month) is a useful reminder that any single-day valuation snapshot is a moving target, not a fixed verdict.
| Rate/Bond Metric | Level (Sept 1, 2026) |
|---|---|
| 10-Year Treasury yield | 4.80% (highest since January 2025) |
| 30-Year Treasury yield | 5.28% |
| 2-Year Treasury yield | 4.39% |
| Market-implied odds of a Fed rate hike this month | ~68%, up from ~40% the prior week |
| SPY trailing P/E (TTM) | ~23.7x |
Sources: GuruFocus GF Value daily/weekly valuation notes (Aug 6–30, 2026); TradingEconomics, MacroMicro, and StreetStats Treasury yield data (Sept 1, 2026).
Deep Dive: A Valuation Picture Complicated by a Rate Story That Just Flipped
GF Value Says “Modestly to Meaningfully Overvalued,” But the Range Matters More Than Any Single Print
GuruFocus’s GF Value model — which blends historical trading multiples, business growth trends, and forward performance estimates into a single intrinsic-value estimate — has placed SPY anywhere from roughly 7% to 14% above fair value at various points across August 2026 alone. That’s not model inconsistency so much as it reflects genuinely volatile inputs: intrinsic value estimates move as new earnings data, Treasury yields, and macro releases feed the model, while the market price itself has been chopping in a roughly $765–$777 band.
The consistent signal across every reading, regardless of the exact overvaluation percentage: SPY’s GF Score — a composite of financial strength, profitability, growth, valuation, and momentum — has held steady in the 85–86 out of 100 range throughout the period. In plain terms, the model is saying the same thing every week: fundamentals underneath the index remain genuinely strong (profitability and growth sub-scores of 8/10), but the price paid for those fundamentals leaves a thin-to-negative margin of safety for new money entering at current levels.
The Bigger Story: The Fed Narrative Just Reversed
This is the detail most surface-level coverage of SPY valuation is missing entering September: the market’s rate-path assumption flipped over the course of late August. Earlier in the summer, a weak July jobs report and cooling CPI prints had markets leaning toward the possibility of rate cuts later in the year. By the final week of August, that had reversed. Fed Chair Warsh’s remarks at the Jackson Hole symposium reaffirmed a commitment to bringing inflation down, and Fed Governor Barr followed with comments that the central bank should be prepared to raise rates if inflation does not subside. The market reaction was immediate: odds of a 25-basis-point hike this month jumped from around 40% to roughly 68% within a single week, and the 10-year Treasury yield climbed for five consecutive sessions to reach 4.80% — its highest level since January 2025.
The proximate driver of the inflation concern is oil. Renewed geopolitical tensions have pushed crude prices higher, and rising energy costs are feeding directly into inflation expectations at a moment when the labor market — job openings edged higher in July, layoffs fell, and manufacturing expanded for an eighth straight month in August — is not showing the kind of softness that would normally take a hike off the table.
Why Rising Long-Term Yields Compress Equity Valuation Models
Every discounted-cash-flow-style valuation — including the general category of model GuruFocus’s GF Value falls into — is sensitive to the discount rate applied to future earnings. When the 10-year Treasury yield rises from a level closer to 4.3% (its trailing 12-month average) to a fresh cycle high of 4.80%, the “risk-free” comparison rate against which equity earnings yields are judged rises with it. All else equal, a higher discount rate lowers the intrinsic value estimate for the same stream of future earnings — which is part of why GF Value estimates for SPY have generally trended toward higher overvaluation readings as yields have climbed through August, even as the S&P 500 itself continued grinding higher.
The Seasonal Overlay: September’s Historical Track Record
Independent of valuation or rates, the calendar itself carries a well-documented pattern: the back half of September has historically been the weakest stretch of the trading year for the S&P 500, producing slightly negative average returns more often than any other multi-week period. That seasonal headwind, layered on top of a rate environment that just turned more hawkish and a valuation model flashing high-single to low-double-digit overvaluation, is the combination coverage of SPY heading into September 2026 should actually be weighing — not any single data point in isolation.
What a 23.7x Trailing P/E Actually Tells You
SPY’s trailing twelve-month P/E of approximately 23.7x sits meaningfully above long-run historical averages for the index (commonly cited in the high teens), though comparisons are complicated by the absence of a readily available 5-year median P/E in the underlying data used for this analysis — a data-availability gap GuruFocus itself has flagged in several of its own valuation notes. Investors should treat any single trailing-multiple comparison as one input among several (GF Value, GF Score, rate environment, seasonal pattern) rather than a standalone verdict.
Actionable Takeaways for Investors
- Don’t anchor to a single GF Value overvaluation percentage. The swing from 7.0% to 14.0% overvalued within the same month shows the model is sensitive to short-term inputs; look at the trend and the GF Score (steady at 85–86) together, not one week’s headline number.
- Track the 10-year Treasury yield as a leading valuation signal. A continued climb toward or past 4.80–5.00% would mechanically pressure equity valuation models further; a reversal back toward the 4.30% trailing average would ease that pressure.
- Reassess the “rate cut” assumption baked into your portfolio. If your equity allocation was built assuming Fed easing later in 2026, the shift toward hike odds of ~68% for this month’s meeting is a material change worth revisiting with a financial advisor.
- Respect September seasonality without overreacting to it. Historical weak-September patterns are a real, well-documented statistical tendency, not a guarantee — use it as a reason for disciplined position sizing rather than a market-timing signal on its own.
- Watch oil prices as the connective tissue between geopolitics, inflation, and equity valuation. The current inflation concern feeding into hike odds is substantially an energy-price story; a de-escalation in the geopolitical tensions driving crude higher would likely ease both bond yields and equity valuation pressure simultaneously.
Frequently Asked Questions
Is the S&P 500 overvalued right now? By GuruFocus’s GF Value metric, SPY has traded between roughly 7% and 14% above its estimated intrinsic value at various points across August 2026, with a GF Score of 85–86 out of 100 indicating strong underlying fundamentals despite the valuation premium — the honest answer is “modestly to meaningfully” overvalued depending on which week’s model reading you use, not overvalued by one fixed number.
Will the Federal Reserve raise or cut interest rates in September 2026? As of early September 2026, market pricing has shifted toward pricing in meaningful odds (around 68%) of a rate hike rather than a cut, reversing the rate-cut expectations that dominated earlier in the summer, driven by hawkish Fed commentary at Jackson Hole and rising oil-driven inflation concerns.
Why did the 10-year Treasury yield hit 4.80% in September 2026? The 10-year Treasury yield climbed for five consecutive sessions to reach 4.80% — its highest level since January 2025 — driven by rising oil prices amid renewed geopolitical tensions and hawkish signals from Federal Reserve officials suggesting a rate hike may be needed to control inflation.
How does September seasonality typically affect the S&P 500? Historically, the latter half of September has been the weakest multi-week stretch of the trading year for the S&P 500, often producing slightly negative average returns, though this is a statistical tendency rather than a reliable predictor for any specific year.

Business Insurance for Digital Exports: Protecting Your Company in the AI Era

Real Estate Crash Predictions 2026: Data-Backed Regional Guide

What is a “Lead-Left” Bank? Unpacking Morgan Stanley’s Role in Anthropic’s Mega-IPO

Is SPY Overvalued in September 2026? Fed Rate Hike Odds & Intrinsic Value

Pakistan’s KSE-100 Nears Record Territory Even as the Trade Gap Persists

US Consumer Sentiment Sinks as Retail Sales Drop

Barclays Q2 2026 Results: Income Beats, Costs Rise 7%

Pakistan’s Remittance Lifeline: Why Gulf Exposure Is a Hidden Risk

Dubai’s Rise to the World’s 7th Financial Hub: Inside the D33 Push

China EV Exports Hit Record High in 2026

UK’s “National Contributions Tax” Explained: Burnham-Era Reform 2026

Russia’s Strange Problem in 2026: Its Currency Is Too Strong

Section 301 Forced Labor Tariffs 2026: 60 Countries Affected

UK National Contributions Tax: Burnham’s Radical Tax Plan

Top 15 Stocks for Investment in 2026 in PSX: Your Complete Guide to Pakistan’s Best Investment Opportunities
Top 15 Stocks for Investment in 2026 in PSX: Your Complete Guide to Pakistan’s Best Investment Opportunities

Debunking IMF Program Myths: Reconfiguring Engagement for True National Ownership in a Volatile World

Top 10 Mutual Fund Managers in Pakistan for Investment in 2026: A Comprehensive Guide for Optimal Returns

What the U.S. Attack on Venezuela Could Mean for Oil and Canadian Crude Exports: The Economic Impact

China’s 50% Domestic Equipment Rule: The Semiconductor Mandate Reshaping Global Tech

15 Most Lucrative Sectors for Investment in Pakistan: A 2025 Data-Driven Analysis

Pakistan’s Export Goldmine: 10 Game-Changing Markets Where Pakistani Businesses Are Winning Big in 2025
15 Most Lucrative Sectors for Investment in Pakistan: A 2025 Data-Driven Analysis
15 Most Lucrative Sectors for Investment in Pakistan: A 2025 Data-Driven Analysis

Pakistan’s Stock Market Renaissance: How 2025’s Hottest Investment Opportunity Is Democratizing Wealth—A Complete Beginner’s Guide

Pakistan’s Economic Outlook 2025: Between Stabilization and the Shadow of Stagnation
Pakistan’s Economic Outlook 2025: Between Stabilization and the Shadow of Stagnation

China’s Property Woes Could Last Until 2030—Despite Beijing’s Best Censorship Efforts
-
 Markets & Finance8 months ago
Top 15 Stocks for Investment in 2026 in PSX: Your Complete Guide to Pakistan’s Best Investment Opportunities
-
Markets & Finance8 months ago
Top 15 Stocks for Investment in 2026 in PSX: Your Complete Guide to Pakistan’s Best Investment Opportunities
-
 Analysis7 months ago
Debunking IMF Program Myths: Reconfiguring Engagement for True National Ownership in a Volatile World
-
 Investment8 months ago
Top 10 Mutual Fund Managers in Pakistan for Investment in 2026: A Comprehensive Guide for Optimal Returns
-
 Global Economy8 months ago
What the U.S. Attack on Venezuela Could Mean for Oil and Canadian Crude Exports: The Economic Impact
-
 Asia8 months ago
China’s 50% Domestic Equipment Rule: The Semiconductor Mandate Reshaping Global Tech
-
 AI9 months ago
15 Most Lucrative Sectors for Investment in Pakistan: A 2025 Data-Driven Analysis
-
 Exports9 months ago
Pakistan’s Export Goldmine: 10 Game-Changing Markets Where Pakistani Businesses Are Winning Big in 2025