
Analysis
Trump’s 2025-2026 Tariffs on Asia and Europe: Justified Protectionism or Self-Inflicted Economic Wound?

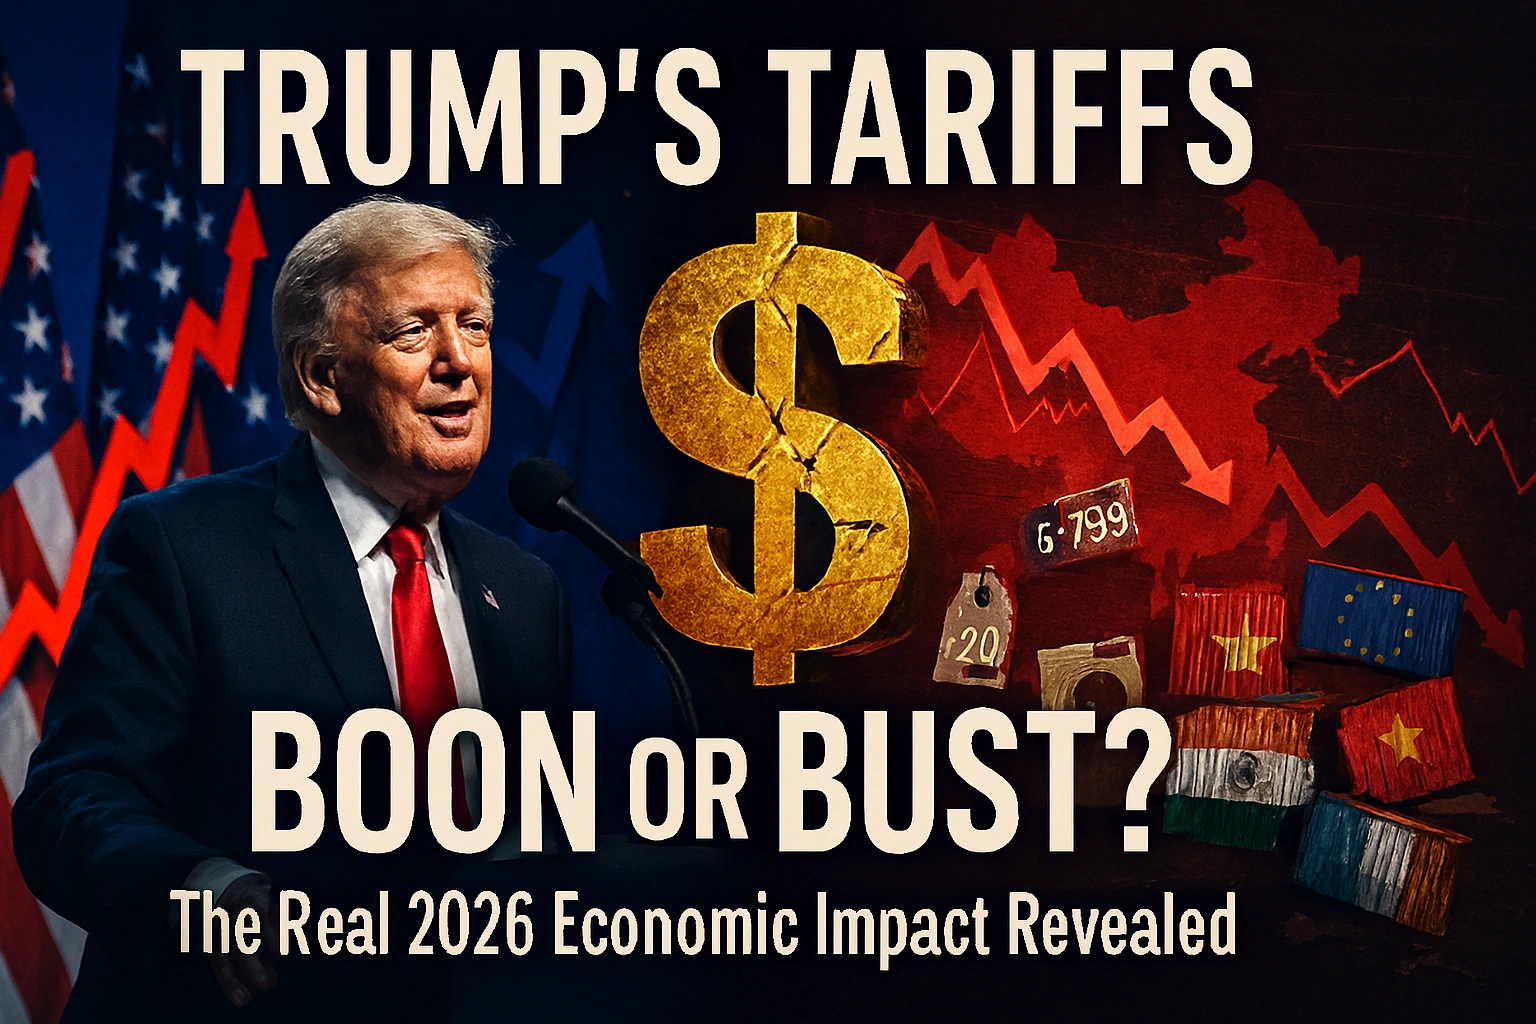
On a frigid January morning in Cincinnati, Sarah Chen stands in the aisles of her family’s small electronics shop, calculator in hand, recalculating profit margins for the third time this quarter. The wholesale price of the Chinese-made tablets that once flew off her shelves has jumped 34% since spring 2025. “I either absorb the hit or pass it to customers who are already stretched thin,” she tells me, her frustration palpable. “Either way, I lose.” Three thousand miles away, in a gleaming Tesla factory outside Austin, workers celebrate a modest expansion—twenty new jobs assembling battery components that once came exclusively from South Korea, now partially sourced domestically to sidestep tariff costs. Two stories, one policy: President Trump’s sweeping 2025-2026 tariff regime, the most aggressive protectionist turn in American trade policy since the Smoot-Hawley era.
Nearly two years into Trump’s second-term trade war, the economic verdict remains deeply contested. The administration points to $287 billion in tariff revenue collected in 2025—a dramatic increase from pre-2025 levels—and argues that reciprocal tariffs are finally leveling a playing field long tilted against American workers. Critics counter with mounting evidence of inflationary pressures, widening trade deficits, and minimal manufacturing gains that suggest the cure may be worse than the disease. As we approach the midpoint of 2026, the fundamental question persists: Are Trump’s tariffs justified protectionism reclaiming economic sovereignty, or a self-inflicted wound bleeding American consumers and competitiveness?
The Architecture of Trump’s Trade Offensive
The current tariff structure represents an unprecedented escalation in postwar American trade policy. Beginning in early 2025, the Trump administration implemented a multi-tiered system: a universal baseline tariff of 10-20% on virtually all imports, elevated rates of 60-125% on Chinese goods, and targeted duties of 25-50% on European automobiles, steel, and select agricultural products. The average effective U.S. tariff rate—hovering around 2.5% for decades—rocketed to approximately 27% by late 2025, according to Peterson Institute for International Economics analysis.
The stated rationale rests on three pillars. First, reciprocity: matching trading partners’ tariff levels to force negotiations toward lower barriers globally. Second, revenue generation: using import duties to offset income tax cuts and fund domestic priorities. Third, industrial policy: reshoring critical supply chains in semiconductors, pharmaceuticals, and defense materials deemed vital to national security. In Trump’s framing, decades of “unfair” trade deals hollowed out the Rust Belt, enriched China, and left America dangerously dependent on adversaries for essential goods.
There’s historical precedent for this worldview. Alexander Hamilton championed tariffs to nurture infant American industries. The post-Civil War “American System” used protectionism to fuel industrialization. Even modern economic giants like South Korea and Japan deployed strategic tariffs during development. The question isn’t whether protectionism can ever work—it’s whether Trump’s specific implementation, in today’s deeply integrated global economy, achieves its goals without prohibitive costs.
Revenue Gains: Real but Misleading
The Trump administration’s headline achievement is undeniable: tariff revenue surged to $287 billion in 2025, compared to roughly $80 billion annually in the pre-Trump era. Treasury Secretary Scott Bessent hailed this as vindication, arguing tariffs function as a “consumption tax on foreign goods” that funds government without burdening American workers.
Yet this framing obscures crucial economic reality. Unlike income taxes paid by high earners, tariffs function as regressive consumption taxes. When importers pay the tariff at the border, those costs cascade through supply chains, ultimately landing on retail prices. A Brookings Institution study estimated that Trump’s 2025 tariffs cost the average American household between $1,800 and $2,400 annually through higher prices on everything from smartphones to sneakers to strawberries. Low-income families, who spend proportionally more on goods than services, bear the heaviest burden.
Moreover, tariff revenue must be weighed against offsetting economic drags:
- Reduced import volumes: As prices rise, Americans buy fewer foreign goods, eventually shrinking the tariff base itself
- Retaliation costs: European Union and Chinese counter-tariffs hammered U.S. agricultural exports, requiring $12 billion in emergency farm aid in 2025
- Productivity losses: Inefficient domestic production substituting for cheaper foreign goods reduces overall economic output
- Administrative burden: Customs enforcement, trade dispute litigation, and exemption processes consume billions annually
When accounting for these factors, Yale Budget Lab economists calculate that each dollar of tariff revenue corresponds to $1.80 in total economic cost—hardly the free lunch portrayed.
The Manufacturing Renaissance That Wasn’t
Perhaps the most politically salient promise of Trump’s tariff regime was a renaissance in American manufacturing—factories returning from Shenzhen and Stuttgart, blue-collar jobs reviving the Midwest. The empirical record shows modest gains at best, illusions at worst.
U.S. manufacturing employment did tick upward in 2025, adding approximately 140,000 jobs according to Bureau of Labor Statistics data. Specific sectors saw notable activity: semiconductor fabrication plants broke ground in Arizona and Ohio, battery component production expanded in Michigan, and some textile operations relocated from Vietnam to North Carolina. The administration trumpets these wins as proof of concept.
Dig deeper, however, and the picture complicates. Federal Reserve analysis reveals that many “reshored” jobs represent capital-intensive automation rather than labor-intensive production. A chip fab employing 800 engineers and technicians replaces a Chinese factory employing 15,000 assembly workers—beneficial for high-skilled employment, but not the working-class bonanza promised. Meanwhile, manufacturing output as a percentage of GDP remained essentially flat in 2025, suggesting production gains merely kept pace with overall economic growth rather than outperforming.
More troubling, supply chains proved far more complex than tariff architects anticipated. Rather than returning to the U.S., many manufacturers simply rerouted through third countries to evade duties—China ships steel through Mexico, electronics route via Malaysia, pharmaceuticals detour through India. World Bank trade flow data documents this “trade deflection” phenomenon, which preserves Chinese production while generating paperwork, transportation costs, and environmental waste without yielding American jobs.
The hardest-hit were small and medium manufacturers dependent on imported components. A Michigan auto parts supplier I spoke with last fall described the squeeze: “We import specialized steel from Germany because no American mill produces it. The 40% tariff tripled our costs overnight. We laid off twelve people and cancelled our expansion.” For every factory celebrating tariff protection, another curses tariff-induced input costs.
Consumer Costs and Inflation’s Quiet Bite
The most direct economic impact of Trump’s tariffs landed at checkout counters nationwide. While headline inflation moderated from 2022-2023 peaks, consumer price data reveals tariff-specific spikes in key categories throughout 2025:
- Electronics: Laptops, smartphones, and televisions rose 12-18% on average, disproportionately affecting middle-class families and students
- Apparel and footwear: Clothing prices increased 8-11%, hitting budget-conscious shoppers hardest
- Automobiles: Both imported and domestic vehicles jumped 6-9% as automakers passed through tariff costs and faced reduced foreign competition
- Home appliances: Washing machines, refrigerators, and HVAC systems climbed 7-13%, devastating first-time homebuyers
Research from the National Bureau of Economic Research quantified the phenomenon: for every percentage point increase in effective tariff rates, consumer prices rise approximately 0.3 percentage points within 12-18 months. Applied to Trump’s 24-point tariff increase (from ~3% to ~27%), the model predicts a 7-point inflationary contribution—precisely what Federal Reserve economists privately estimate, according to sources familiar with internal models.
The Federal Reserve faced an impossible bind. Raising interest rates to combat tariff-driven inflation would choke economic growth and employment. Accommodating higher prices would erode purchasing power and risk unanchored expectations. Chairman Jerome Powell’s carefully parsed statements throughout 2025 reflected this dilemma: acknowledging “supply-side price pressures from trade policy” while maintaining data-dependent gradualism.
For millions of Americans like Sarah Chen in Cincinnati, macroeconomic abstractions translate to lived hardship. Tariffs don’t feel like abstract policy—they feel like shrinking purchasing power, deferred family vacations, and anxiety about making ends meet.
Asia’s Response: Adaptation and Defiance
China’s reaction to Trump’s tariff offensive underscored the limits of unilateral trade pressure. Rather than capitulating to U.S. demands, Beijing doubled down on industrial strategy and supply chain resilience. Chinese customs data revealed a record $1.2 trillion trade surplus in 2025—up from $823 billion in 2024—driven by surging exports to Europe, Southeast Asia, and Africa that offset declining U.S. sales.
The Communist Party framed Trump’s tariffs as vindication of Xi Jinping’s “dual circulation” strategy: reducing dependence on Western markets while dominating critical technology supply chains. Massive subsidies flowed to electric vehicles, solar panels, and advanced semiconductors, flooding global markets and undercutting both American and European competitors. The European Union, initially sympathetic to U.S. complaints about Chinese overcapacity, found itself imposing its own duties on Chinese EVs to protect nascent industries—fragmenting rather than unifying the Western response.
Meanwhile, Southeast Asian economies emerged as clear winners. Vietnam, Thailand, and Malaysia attracted factories fleeing both Chinese tariffs and rising Chinese labor costs, positioning themselves as neutral intermediaries in the U.S.-China rivalry. The ASEAN bloc’s combined exports to the U.S. jumped 23% in 2025, with Vietnamese electronics and Thai auto parts capturing market share. Ironically, Trump’s tariffs accelerated precisely the regional supply chain diversification China had resisted for years—but without returning production to American soil.
Japan and South Korea navigated cautiously, securing partial tariff exemptions through bilateral negotiations while deepening technological partnerships with China despite U.S. pressure. The administration’s transactional approach—threatening allies with tariffs, then granting reprieves in exchange for concessions—bred resentment even among traditional partners. Seoul’s decision to join China’s Regional Comprehensive Economic Partnership framework in late 2025, after decades of resistance, signaled eroding American influence.
Europe’s Dilemma: Retaliation and Recession Fears
Transatlantic relations, already strained over climate policy and defense spending, deteriorated sharply under Trump’s tariff regime. The European Union, facing 25-50% duties on automobiles, machinery, and luxury goods, retaliated with €48 billion in counter-tariffs targeting politically sensitive American exports: Kentucky bourbon, Florida orange juice, Iowa pork, California wine, and Harley-Davidson motorcycles.
The economic damage proved mutual. German automakers BMW, Volkswagen, and Mercedes-Benz—major employers in South Carolina, Alabama, and Georgia—cut U.S. production plans, citing tariff uncertainty and retaliatory costs. French luxury conglomerate LVMH postponed a Texas expansion. Italian food exporters scrambled to find alternatives to the lucrative American market. The International Monetary Fund downgraded eurozone growth forecasts by 0.4 percentage points for 2026, attributing half the revision to U.S. trade disruptions.
Yet Europe’s response also revealed deeper fractures. Hungary and Italy, led by populist governments sympathetic to Trump’s nationalism, resisted aggressive retaliation. France and Germany pushed for tougher measures to defend European industry. The disunity emboldened the Trump administration to negotiate bilaterally, offering Germany partial auto tariff relief in exchange for increased defense spending—undermining EU cohesion and empowering American divide-and-conquer tactics.
The strategic irony was profound: at the very moment Western democracies confronted authoritarian China’s economic coercion and Russia’s military aggression, Trump’s tariffs fractured the alliance that built the postwar liberal order. Brussels officials privately despaired that America’s turn inward left Europe geopolitically isolated and economically vulnerable—precisely the outcome Beijing and Moscow desired.
The Bigger Picture: Protection or Economic Drag?
Stepping back from sectoral details, what does the macroeconomic evidence reveal about Trump tariffs’ net impact? Three overarching conclusions emerge from academic research and institutional analysis:
First, costs substantially exceed benefits for the overall economy. The Tax Foundation’s comprehensive modeling estimates Trump’s 2025-2026 tariff regime will reduce long-run GDP by 0.7%, eliminate approximately 650,000 jobs across all sectors (even accounting for manufacturing gains), and decrease average household incomes by $2,100 annually. These aggregate losses swamp the gains to protected industries and tariff revenue collected.
Second, distributional effects are starkly regressive. While some manufacturing workers in specific sectors benefit through higher wages and job security, far more Americans lose through higher consumer prices, reduced employment in trade-dependent services, and diminished investment returns. The bottom income quintile bears 2.8 times the proportional burden of the top quintile, according to Congressional Budget Office incidence analysis—exacerbating inequality Trump claimed to remedy.
Third, geopolitical blowback undermines national security aims. Rather than compelling adversaries to change behavior, tariffs accelerated Chinese self-sufficiency, alienated European allies, and fragmented global supply chains in ways that reduce American leverage. The semiconductor supply chain, ostensibly protected for national security, grew more vulnerable as Asian partners hedged against U.S. reliability and Chinese competitors received massive state support to catch up technologically.
These findings align with historical experience. The Smoot-Hawley tariffs of 1930, enacted during the Great Depression to protect American jobs, instead deepened the crisis as trading partners retaliated and global commerce collapsed. The 2002 Bush steel tariffs, imposed to help struggling Rust Belt mills, cost 200,000 jobs in steel-consuming industries—more than the entire steel sector employed—and were withdrawn after 20 months. Trump’s own first-term washing machine tariffs raised consumer prices by $1.5 billion annually while creating just 1,800 jobs—a cost of $817,000 per job.
The pattern holds: protectionism delivers concentrated, visible benefits to politically powerful industries while imposing diffuse, invisible costs on consumers and downstream businesses. The benefits generate campaign contributions and photo ops at factory openings; the costs appear as slightly higher prices on ten thousand products, barely noticeable individually but devastating in aggregate.
A False Choice Between Sovereignty and Prosperity
The central flaw in Trump’s tariff logic is the premise that America must choose between economic openness and national strength. This false binary ignores the reality that American prosperity and security are deeply intertwined with global integration—not despite it, but because of it.
Consider the semiconductor industry, the crown jewel of strategic competition with China. American firms like Intel, Nvidia, and Qualcomm dominate chip design precisely because they access the world’s best talent (immigrant engineers), the world’s most efficient manufacturing (TSMC in Taiwan), and the world’s largest markets (global sales funding R&D). Tariff walls that fragment this ecosystem don’t strengthen American chips; they handicap innovation by raising costs and shrinking markets.
Or examine agriculture, where the U.S. enjoys genuine comparative advantage. American farmers are the world’s most productive, feeding hundreds of millions globally while supporting rural communities domestically. Chinese and European retaliatory tariffs, triggered by Trump’s trade war, cost U.S. agricultural exporters $27 billion in 2025—obliterating value that took decades to build. Taxpayer bailouts now sustain farmers who once competed profitably on merit.
The alternative to Trump’s blunt protectionism isn’t naive free trade absolutism. It’s smart industrial policy: targeted investments in R&D, infrastructure, and workforce training; strategic stockpiling of critical materials; alliance-based supply chain coordination; enforcement of trade rules against genuine cheating. South Korea didn’t become a semiconductor powerhouse through tariffs; it did so through decades of education investment, R&D subsidies, and export orientation. Germany maintains world-leading manufacturing not by closing borders, but through apprenticeship systems, stakeholder capitalism, and engineering excellence.
Conclusion: Counting the True Cost
As Sarah Chen in Cincinnati wrestles with another round of price increases, and the Austin factory worker celebrates marginal job growth, the fundamental question remains unresolved: Do Trump’s tariffs justify their economic pain?
The empirical record, now approaching two years, offers a sobering answer. Revenue gains are real but regressive. Manufacturing jobs increased modestly but fell far short of promises. Consumer costs mounted significantly. Trade deficits persisted and in some cases widened. Geopolitical isolation deepened. The macroeconomic models projecting net harm have proven distressingly accurate.
This doesn’t mean all protectionism is foolish or that America should passively accept unfair trade practices. Strategic tariffs can protect infant industries, counter dumping, or safeguard national security in genuinely critical sectors. The problem is Trump’s scattershot, maximalist approach: blanket tariffs on allies and adversaries alike, imposed without coordinated strategy, maintained despite mounting evidence of failure, justified through economic nationalism that mistakes autarky for strength.
The tragic irony is that legitimate concerns—Chinese overcapacity, supply chain vulnerabilities, working-class dislocation—get lost in the chaos of indiscriminate protectionism. By crying wolf with tariffs on European cheese and Canadian lumber, the administration undermines its own case for action on genuinely problematic Chinese subsidies or technology theft.
As voters contemplate America’s economic trajectory heading toward 2028, the tariff experiment offers a clear lesson: economic sovereignty isn’t achieved by raising walls, but by building ladders—investing in innovation, education, and infrastructure that make American workers the most productive on earth. Protection from competition breeds complacency; competition with support breeds excellence.
The choice isn’t between globalization and workers, between openness and security. It’s between smart policies that strengthen American competitiveness within global markets, and blunt instruments that inflict economic pain while claiming to protect us from the world. Two years of Trump’s tariffs suggest we’ve chosen poorly. The question now is whether we’ll learn from the evidence—or continue counting costs we can’t afford to pay.



Quick answer: The Social Security Administration has confirmed a 3.6% cost-of-living adjustment (COLA) for 2027. Retirement, survivor and disability benefit increases generally appear in January 2027 payments, while the higher federal Supplemental Security Income (SSI) amount first becomes payable on December 31, 2026 because January 1 is a holiday. The SSA’s October 14 announcement and official 2027 calendar hub are the authoritative starting points.
People searching for the 2027 Social Security calendar usually have two distinct questions: When will the money arrive? and How much will I receive? The payment schedule is mainly determined by program and birth-date rules. The amount depends on the individual’s existing benefit, the COLA, deductions and other adjustments. A national chart cannot predict an individual’s net bank deposit.
The 2027 second, third and fourth Wednesday calendar
For most people receiving Social Security retirement, survivor or disability benefits, the payment day depends on the birth date attached to the benefit record. The second Wednesday generally covers dates from the 1st–10th, the third covers 11th–20th, and the fourth covers 21st–31st. The SSA scheduling FAQ explains the standard rule and groups that use a different cycle.
| Benefit month | Birth date 1–10: 2nd Wednesday | Birth date 11–20: 3rd Wednesday | Birth date 21–31: 4th Wednesday |
|---|---|---|---|
| January 2027 | Jan. 13 | Jan. 20 | Jan. 27 |
| February 2027 | Feb. 10 | Feb. 17 | Feb. 24 |
| March 2027 | Mar. 10 | Mar. 17 | Mar. 24 |
| April 2027 | Apr. 14 | Apr. 21 | Apr. 28 |
| May 2027 | May 12 | May 19 | May 26 |
| June 2027 | Jun. 9 | Jun. 16 | Jun. 23 |
| July 2027 | Jul. 14 | Jul. 21 | Jul. 28 |
| August 2027 | Aug. 11 | Aug. 18 | Aug. 25 |
| September 2027 | Sep. 8 | Sep. 15 | Sep. 22 |
| October 2027 | Oct. 13 | Oct. 20 | Oct. 27 |
| November 2027 | Nov. 10 | Nov. 17 | Nov. 24 |
| December 2027 | Dec. 8 | Dec. 15 | Dec. 22 |
Important: This table is a calendar computation of the ordinary Wednesday cycle, not a substitute for SSA’s official published payment calendar. Holidays can shift issuance to a preceding business day, and several beneficiary categories use different payment dates. For example, some people who began benefits before May 1997 or receive both SSI and Social Security use the third-of-the-month cycle. Check the official SSA calendar for 2027 before setting a direct debit or making a payment commitment.
How the 2027 COLA changes benefits
The SSA’s official press release says the 3.6% COLA will increase benefits for nearly 72 million Social Security recipients starting with payments in January 2027; about 7.3 million SSI recipients will start seeing higher payments on December 31, 2026. Some individuals belong to both groups, so the two populations should not simply be added to estimate unique recipients.
On average, Social Security retirement benefits are expected to rise by about $75 a month, according to the same announcement. An average increase is not a universal raise. Someone with a $1,000 monthly gross benefit would see an arithmetic 3.6% rise of about $36 before other adjustments, while someone with $2,500 would see about $90. Actual notices and statutory rounding rules determine each beneficiary’s individual amount.
| SSA published indicator | Before 2027 COLA | After 2027 COLA |
|---|---|---|
| Estimated average retired worker benefit | $2,095 | $2,170 |
| Estimated average disabled worker benefit | $1,642 | $1,701 |
| Federal SSI maximum, individual | $994 | $1,029 |
| Federal SSI maximum, eligible couple | $1,491 | $1,544 |
Source: SSA’s 2027 COLA fact sheet. The retirement and disability figures are estimated averages, while the SSI figures are federal maximum standards; they are not interchangeable with an individual’s award notice.
Why some 2027 benefits start arriving in December 2026
The agency explains that January SSI payments are advanced to the last business day of December when January 1 is a federal holiday. For the 2027 adjustment, that date is Thursday, December 31, 2026. Beneficiaries should not treat an SSI deposit appearing in December as an extra 2026 benefit or an omitted January payment. It is the payment for the next benefit month, issued early.
The SSA’s COLA FAQ explicitly distinguishes the start of higher SSI payments from the first increased regular Social Security checks. This is an important budgeting detail for people receiving both programs. Receiving a single account deposit on December 31 does not mean every category of benefit has the same schedule.
An additional complication occurs for recipients in special payment groups that use the third of the month rather than Wednesday birth-date rules. The third of January 2027 falls on a Sunday, close to the January 1 holiday. Consult the official agency calendar for the adjusted date rather than mechanically assuming payment occurs Sunday, January 3. The precise date of a bank’s posting can also vary from SSA’s issuance date.
The 2027 SSI standards and why your deposit may be lower
The federal maximum SSI payment for 2027 is $1,029 per month for an eligible individual and $1,544 for an eligible couple, according to SSA’s SSI payment-amount schedule. Those figures are ceilings for specified eligibility situations, not guaranteed deposits for everyone receiving SSI.
SSI is a means-tested program. Countable income and other eligibility factors can reduce the federal payment. Some states supplement SSI, and their rules differ. A beneficiary who receives $650 monthly in 2026 cannot simply assume the 2027 bank deposit will become $1,029. The payment may also be affected by living arrangements and other circumstances.
SSA’s 2027 fact sheet also shows SSI federal resource limits still at $2,000 for an individual and $3,000 for a couple. The fact that payment standards increase with inflation does not mean every other eligibility threshold rises by the same percentage. People applying for SSI should review the entire set of rules rather than focusing only on the maximum award.
Does a 3.6% COLA mean 3.6% more money in your bank account?
Not necessarily. The COLA applies to the relevant gross benefit calculation. A person’s net deposit can also reflect Medicare premiums, tax withholding, recovery of overpayments, garnishments in permitted cases and other statutory adjustments. Consequently, a 3.6% gross increase can translate into a different percentage change in the deposited amount.
For budget planning, first compare the 2026 and 2027 gross Social Security benefit on the award or COLA notice, then inspect deductions separately. If the net amount surprises you, do not assume a processing error without checking whether a premium or withholding item changed. Use the my Social Security portal to review official personal notices rather than trusting a generic calculator that cannot see your account.
Inflation also varies by household. The 3.6% COLA is calculated under a statutory method using the CPI-W, not a custom estimate of each retiree’s expenses. A person with unusually high housing, medical or utility costs might experience a greater price increase than the official adjustment compensates for; another may experience less. The COLA is intended to help benefits keep pace with measured prices, not guarantee unchanged purchasing power for every household.
How much can you earn while collecting benefits?
Some Social Security recipients work while collecting retirement or disability benefits. The rules vary by benefit category and age. The SSA 2027 COLA fact sheet lists an earnings-test limit of $25,560 for workers under full retirement age and $67,920 for the year someone reaches full retirement age, applicable to earnings in months before reaching that age. These limits are different from SSI income rules and disability work-incentive thresholds.
The earnings test can withhold some benefits above limits, but it does not mean wages are simply confiscated or that all working retirees lose benefits permanently. Social Security later adjusts for certain months in which benefits were withheld under retirement earnings rules. The best answer for a particular worker depends on age, retirement entitlement and other circumstances.
For disability beneficiaries, separate substantial-gainful-activity and trial-work-period rules may apply. The fact sheet shows different thresholds for 2027. Anyone considering additional work while receiving disability or SSI benefits should check the precise applicable program with SSA, because using a retirement earnings limit for disability can produce harmful errors.
How to find your personal 2027 COLA notice
SSA says most people with a my Social Security account can view their COLA notices online when they become available, and paper notices arrive later for other recipients. The SSA FAQ describes the notice rollout and says that a person whose letter has not arrived immediately should not assume something is wrong. A secured official account is preferable to links in unsolicited emails that ask for credentials.
A useful checklist is to confirm your name, benefit type, 2026 amount, 2027 amount, deductions and bank account information. If anything appears inconsistent, contact SSA through a verified channel. Do not provide a Social Security number or login code to a caller claiming a higher payment can be ‘activated’ for a processing fee. COLA adjustments are part of the statutory benefit system; they do not require paying someone for enrollment.
Frequently asked questions
What is the Social Security COLA for 2027?
3.6%, formally announced by the Social Security Administration on October 14, 2026.
When is the first increased Social Security check in 2027?
The increase appears in January 2027 regular Social Security payments, following each recipient’s applicable payment schedule. Higher SSI payments first arrive December 31, 2026.
Is the average increase really $75?
SSA estimates the average monthly benefit of retired workers will rise by about $75, from approximately $2,095 to $2,170. Individual increases vary.
Does everyone receive Social Security on the second Wednesday?
No. Second, third and fourth Wednesdays apply to the major birth-date groups; special categories and holiday adjustments use other dates.
How much is the 2027 federal SSI maximum?
SSA lists $1,029 for an eligible individual and $1,544 for an eligible couple. Actual payments depend on eligibility, income and other rules.
Should I budget the whole year from this chart alone?
Use it as an orientation, then download the official 2027 payment calendar from SSA and check individual benefit notices. Dates and net deposits should be confirmed before scheduling automatic withdrawals.
Bottom line
The two verified anchors for 2027 are a 3.6% COLA and an official SSA calendar that differentiates regular Social Security, SSI and exception groups. Generic Wednesday charts are useful, but the safest budgeting approach combines the published schedule with your own notice. A slightly earlier payment can be a calendar adjustment—not an extra benefit—and a larger gross award need not mean an identical net increase.

The KSE-100 was weak in the days around the SBP’s 26 October decision. Business Recorder reported the index down more than 800 points in the opening minutes of Monday, at about 161,542, and Tribune had it near 161,660 by midday, an intraday range of roughly 161,250 to 162,488. The Friday before, the index had lost more than 1,300 points as fighting between Saudi Arabia and the Houthis intensified and oil rose. Arif Habib’s head of research, Sana Tawfik, attributed the selling to two things: global weakness on higher oil and caution ahead of the rate decision.
The sectors named in reports were broad: automobile assemblers, cement, commercial banks, oil and gas explorers, oil marketing companies, power generation and refineries. Index heavyweights such as HUBCO, OGDC, MARI, PPL, HBL, MEBL and NBP traded lower at the opening.
The SBP then raised the policy rate by 50 bps to 12%, the first rise since April’s 100 bps move. The post-decision close was not retrieved; check it before publishing.
Why Sectors React Differently
Cement and autos (leveraged, demand-sensitive). Higher borrowing costs raise financing expenses for companies and can dampen private credit and investment. After April’s hike, analysts reported in Tribune that cyclicals such as cement would carry the weight of higher rates.
Commercial banks (mixed). The same April analysis suggested banks could see relative support over the medium term, as higher rates typically widen margins on assets. But banks also sold off in recent sessions, reflecting broader risk-off sentiment and sensitivity to government borrowing costs, so the benefit is not automatic.
Oil and gas explorers and oil marketers (oil-linked). These trade on the oil price and on circular-debt and pricing-policy questions as much as on rates. With Brent near $115, the oil story can outweigh the rate story.
Power producers and refineries. Sensitive to financing costs, energy-pricing decisions and the IMF’s push for timely tariff adjustments.
Fertiliser. Reported among the sectors with selling pressure after April’s hike; gas pricing and input costs matter alongside rates.
What the Hike Means for Valuations
Higher policy rates raise the return investors can earn on risk-free assets, which pushes down the price they will pay for equities. With inflation at 10.26% in September and a policy rate of 12%, the real return on fixed income is modestly positive. That competes with equities for capital, particularly after a strong multi-year run in the index.
Scenarios for the Next Few Weeks
- Oil retreats on a Qatari deal: inflation fears ease, and the market could recover some of the loss. The reply from Iran is due by the end of the week.
- Stalemate: headline-driven trading with sector rotation based on oil sensitivity.
- Escalation or another hike on 14 December: pressure on cyclicals and leveraged names.
These are scenarios, not forecasts.
What Investors Should Check
- Company debt levels and interest coverage (leveraged names are most exposed).
- Exposure to oil prices and government pricing policy.
- Dividend yield versus T-bill and deposit rates.
- Upcoming earnings season commentary on financing costs.
The PSX sold off ahead of a hike that was widely expected. What matters now is whether oil and the Iran talks ease or worsen the inflation outlook, because that, not Monday’s 50 bps, will decide the 14 December MPC and the market’s direction.

The artificial-intelligence revolution has a rather old-fashioned problem: someone must pay for the buildings, chips, cooling systems and electricity before the promised productivity gains arrive. For Big Tech, the crucial question this earnings season is no longer whether AI is exciting. It is whether the economics of building capacity can satisfy the owners of public companies.
A Reuters examination of hyperscaler spending found that rising AI infrastructure commitments were putting free cash flow under pressure even as cloud and AI revenues expanded. With Alphabet, Microsoft, Amazon and other major businesses due to face further investor scrutiny during the late-October reporting period, the argument is shifting from technological capability to return on invested capital.
Capex is not the same as an expense
Capital expenditure includes spending on long-lived assets such as data centres, servers and network infrastructure. Its accounting cost is generally spread over time through depreciation. The cash often leaves sooner. A company can therefore report healthy operating profit while its free cash flow weakens because it is building capacity at extraordinary speed.
The gap matters because shares are valued on future economic benefits, not just on the volume of equipment a company can buy. High capex can be an intelligent competitive strategy if that infrastructure becomes heavily utilised and generates attractive cash returns. It can also be a costly mistake if expected demand fails to materialise or hardware becomes outdated sooner than planned.
Five questions earnings calls must answer
Is utilisation improving? A data centre that has been built but not fully used represents tied-up capital. Investors need insight into workloads, capacity commitments and the timing of revenue recognition.
Are AI customers paying enough? Generative AI applications can have meaningful inference costs. Growth in usage is less impressive if each additional request barely covers variable expense.
Will depreciation rise faster than sales? Rapid investment today can depress future reported margins as expensive equipment enters service. Hardware useful lives and replacement cycles deserve scrutiny.
Who funds the power and network expansion? Electricity procurement, cooling and grid upgrades are not trivial afterthoughts. Constraints outside the chip market could delay cash generation.
What happens to shareholder returns? Repurchases and dividends can coexist with investment, but they become harder to sustain if capex consumes a growing share of operating cash flow.
Why this is more than a Silicon Valley story
The AI boom has implications for countries positioned to supply power equipment, semiconductors, engineering and enterprise software. Yet the IMF’s October World Economic Outlook warns that economies outside the technology-investment value chain—especially energy importers—face a difficult global environment. This is a reminder that spectacular capital spending in one sector does not mean broad prosperity everywhere.
Even within successful technology markets, concentration can be a risk. Data-centre demand benefits cloud providers, landlords, utilities and chipmakers, but these businesses occupy different points in the value chain. One company’s purchase is another’s revenue; it is not necessarily proof that the final customer has achieved a worthwhile return.
An earnings dashboard worth publishing
| Metric | Bullish interpretation | Caution sign |
|---|---|---|
| Cloud revenue growth | Customers expand workloads | Growth relies on aggressive discounts |
| Capex as share of operating cash flow | Disciplined build-out | Spending consumes most available cash |
| AI contract backlog | Visibility into future demand | Backlog fails to convert to recognised revenue |
| Gross and operating margins | Pricing power survives cost growth | Inference/depreciation erodes economics |
| Data-centre power availability | Capacity arrives on schedule | Grid constraints delay utilisation |
Investors should watch change rather than one quarter’s absolute number. Management promises can be sincerely made and still prove wrong because of shifts in model architecture, regulation or competition.
The comparison with earlier infrastructure booms
New technology frequently requires substantial upfront investment. Railroads, telecommunications networks and the internet all created enormous social value; not every infrastructure owner earned equally attractive returns. AI may follow a similar pattern: productivity benefits can be large while the firms funding initial construction achieve uneven shareholder outcomes.
That possibility is not an argument against AI. It is an argument against confusing technology adoption with investment profitability. The latter requires credible unit economics, durable customer demand and disciplined financing. Rising bond yields raise the hurdle further by making the cost of capital less forgiving.
The return-on-capital test
A business that spends billions on new servers should eventually earn returns exceeding the economic cost of tying up that capital. To assess this, investors can compare incremental operating profit with the capital added to the business, allowing for taxes, depreciation and replacement spending. The exercise is imperfect because companies rarely disclose every cost of a specific AI product, but it is more meaningful than comparing investment announcements alone.
Training and inference also have different economics. Training large systems demands concentrated computing resources, while inference costs recur as customers use the service. Falling computing cost per query can make AI applications more attractive, but intense competition may pass those savings to customers rather than to the company providing the model. Revenue growth can therefore outpace profit growth.
Long-term contracts deserve close reading. A headline backlog may offer visibility but not guarantee immediate cash receipts or eliminate counterparty risk. Construction delays and power shortages can further separate announced spending from commercially available capacity.
The decisive quarterly question is whether management can demonstrate improving monetisation per unit of infrastructure. Without that evidence, investors are being asked to capitalise promised future demand at a time when the cost of financing that promise is significant.
Does rising AI spending prove that demand is strong?
It signals corporate confidence about future demand, not guaranteed utilisation or profits.
What matters more: earnings or free cash flow?
Both. Earnings capture business performance under accounting rules; free cash flow helps judge capacity to finance spending without additional borrowing or dilution.
Could AI still transform the economy if stocks disappoint?
Yes. Economic benefits to consumers and businesses need not be captured by every investor funding the technology.
The thesis for this earnings season: the market already knows that the machines are powerful. What it wants to know now is whether owning those machines is a profitable business.

Diesel Prices 2026–2027: Why Cheaper Crude May Not Mean Cheap Fuel

2027 Social Security COLA: Key Details and Dates

KSE-100 Sees Major Drop Post-SBP Rate Hike

Big Tech’s AI Spending Test: Can Revenue Catch Up With Capital Expenditure?

AI Infrastructure Investment Strategies for 2026

Pakistan Freelancers Tax 2026: Payments, Documentation and Formal Growth

Strait of Hormuz Crisis: What the Latest Tanker Attacks Mean for Oil, Shipping and Global Trade

AI Customer Service in 2026: What’s Working, What’s Failing, and What to Buy

Open a Savings Account Online: How to Actually Earn 10x the National Average Rate

Global Housing Market 2026: Where Prices Rise, Where They Don’t

PSX and KSE-100 Record Highs: An Insider’s Guide to Pakistan Stocks

So Delicious Dessert Recall: Affected Products, FDA Guidelines, and Consumer Action

Pakistan’s Current Account Deficit Narrows Sharply to $98 Million in August 2026

Japan Eyes 3.5% Defense Spending: What It Means for Bonds, Stocks, and the BOJ

Top 15 Stocks for Investment in 2026 in PSX: Your Complete Guide to Pakistan’s Best Investment Opportunities
Top 15 Stocks for Investment in 2026 in PSX: Your Complete Guide to Pakistan’s Best Investment Opportunities

Debunking IMF Program Myths: Reconfiguring Engagement for True National Ownership in a Volatile World

Top 10 Mutual Fund Managers in Pakistan for Investment in 2026: A Comprehensive Guide for Optimal Returns

China’s 50% Domestic Equipment Rule: The Semiconductor Mandate Reshaping Global Tech

What the U.S. Attack on Venezuela Could Mean for Oil and Canadian Crude Exports: The Economic Impact

15 Most Lucrative Sectors for Investment in Pakistan: A 2025 Data-Driven Analysis

Pakistan’s Export Goldmine: 10 Game-Changing Markets Where Pakistani Businesses Are Winning Big in 2025

How to Become an Active Taxpayer on Pakistan’s FBR Active Taxpayer List (ATL) in 2026: A Step-by-Step Guide

Pakistan’s Stock Market Renaissance: How 2025’s Hottest Investment Opportunity Is Democratizing Wealth—A Complete Beginner’s Guide

Best Investments in Pakistan 2026: Top 10 Low-Price Shares and Long-Term Picks for the PSX
15 Most Lucrative Sectors for Investment in Pakistan: A 2025 Data-Driven Analysis
15 Most Lucrative Sectors for Investment in Pakistan: A 2025 Data-Driven Analysis

Pakistan’s Economic Outlook 2025: Between Stabilization and the Shadow of Stagnation
-
 Markets & Finance10 months ago
Top 15 Stocks for Investment in 2026 in PSX: Your Complete Guide to Pakistan’s Best Investment Opportunities
-
Markets & Finance10 months ago
Top 15 Stocks for Investment in 2026 in PSX: Your Complete Guide to Pakistan’s Best Investment Opportunities
-
 Analysis9 months ago
Debunking IMF Program Myths: Reconfiguring Engagement for True National Ownership in a Volatile World
-
 Investment10 months ago
Top 10 Mutual Fund Managers in Pakistan for Investment in 2026: A Comprehensive Guide for Optimal Returns
-
 Asia10 months ago
China’s 50% Domestic Equipment Rule: The Semiconductor Mandate Reshaping Global Tech
-
 Global Economy10 months ago
What the U.S. Attack on Venezuela Could Mean for Oil and Canadian Crude Exports: The Economic Impact
-
 AI11 months ago
15 Most Lucrative Sectors for Investment in Pakistan: A 2025 Data-Driven Analysis
-
 Exports11 months ago
Pakistan’s Export Goldmine: 10 Game-Changing Markets Where Pakistani Businesses Are Winning Big in 2025