
Global Finance
US Economy to Ride Tax Cut Tailwind—But Tariff Turbulence Complicates the Flight Path


The impact of Trump’s tariffs on prices is projected to peak in the first half of the year, but the $5 trillion tax stimulus may propel growth despite short-term inflationary pressures
When Sarah Chen opened the invoice for her Chicago manufacturing firm’s imported steel components in March 2025, the numbers told a story playing out across American boardrooms: a 15% tariff-induced price increase that would squeeze margins through the spring. But when her accountant calculated the company’s 2025 tax liability in July—after the One Big Beautiful Bill Act became law—she discovered her effective tax rate had dropped by 2.3 percentage points, freeing up capital for the equipment investment she’d postponed for two years.
Chen’s experience captures the dual economic forces shaping 2025 and beyond: historic tax cuts colliding with the most aggressive tariff regime since the 1930s. The Congressional Budget Office projects real GDP growth of 1.4 percent in 2025 and 2.2 percent in 2026, reflecting a near-term drag from trade barriers followed by a tax-fueled acceleration. But beneath these headline numbers lies a more complex reality—one where the timing, magnitude, and distribution of benefits and costs will determine whether America’s economy enters 2027 on strengthened footing or stumbles under the weight of elevated borrowing costs and persistent inflation.
The Tax Cut Engine: $5 Trillion in Fuel
On July 4, 2025, President Trump signed the One Big Beautiful Bill Act, the most sweeping fiscal legislation of his second term. According to the Tax Foundation, the major tax provisions would reduce federal tax revenue by $5 trillion between 2025 and 2034 on a conventional basis. When accounting for economic growth effects, the dynamic score falls to $4 trillion, meaning economic growth pays for about 19 percent of the major tax cuts.
The legislation extends and expands the 2017 Tax Cuts and Jobs Act provisions that were scheduled to expire. For individual filers, the standard deduction will jump by $750 to $16,100 for single filers in 2026. The seven individual income tax brackets remain at their reduced rates, preventing what would have been an automatic tax increase for millions of Americans.
But the law goes further with targeted provisions that benefit specific constituencies. Workers receiving tips can now deduct up to $25,000 of tip income from their taxable income, a provision Trump campaigned on extensively. The child tax credit increased from $2,000 to $2,200 per child for 2025, while parents of children born between 2025 and early 2029 gain access to government-seeded savings accounts with an initial $1,000 deposit.
For businesses, the impact is substantial. The legislation makes permanent the 20% deduction for pass-through entities like partnerships and sole proprietorships, alongside 100% bonus depreciation for equipment investments. These provisions address long-standing complaints from the business community about the uncertainty created by temporary tax code provisions.
The Penn Wharton Budget Model estimates that before economic effects, these proposals would reduce revenues by $6.8 trillion over the 2025-2034 budget window. The discrepancy between various estimates reflects different assumptions about behavioral responses and the scope of provisions modeled.
“J.P. Morgan estimates the announced measures could boost Personal Consumption Expenditures prices by 1–1.5% this year, and the inflationary effects would mostly be realized in the middle quarters of the year. Fed Chair Jerome Powell emphasized that inflation from goods should peak in the first quarter or so, effectively a one-time shift in the price level rather than an ongoing inflation problem.”
How this translates into economic growth depends on several transmission mechanisms. Lower marginal tax rates increase the after-tax return to work, potentially boosting labor supply. Reduced corporate taxation raises the after-tax return on investment, encouraging capital formation. And households with more disposable income tend to increase consumption, stimulating aggregate demand.
The Tax Foundation projects the One Big Beautiful Bill Act would increase long-run GDP by 1.2 percent—a meaningful but not transformative boost. Historical precedent from the 2017 tax cuts offers a reality check. Research found that the corporate tax cut reduced corporate tax revenue by 40 percent and increased corporate investment by 11 percent, while the tax cut increased economic growth and wages by less than advertised by the Act’s proponents.
The Tariff Headwind: Inflation’s Spring Surge
If tax cuts represent the economy’s accelerator, tariffs function as a brake—one applied with increasing force through early 2025. President Trump invoked emergency economic powers to implement what J.P. Morgan chief U.S. economist Michael Feroli describes as a dramatic escalation: This takes the average effective tariff rate from around 10% to just over 23%.
The architecture is complex. A baseline 10% universal tariff applies to nearly all trading partners, with significantly higher rates targeting specific countries and products. The effects ripple through the economy in ways that are only partially visible in real-time data.
Federal Reserve Bank of St. Louis researchers quantified the impact using personal consumption expenditures data. They found that over the June-August 2025 period, tariffs explain roughly 0.5 percentage points of headline PCE annualized inflation and around 0.4 percentage points of core PCE inflation. This represents a meaningful but not catastrophic contribution to inflation running above the Federal Reserve’s 2% target.
The Tax Foundation calculates that the tariffs amount to an average tax increase of $1,200 per US household in 2025 and $1,400 in 2026—a hidden levy that falls disproportionately on lower-income households who spend a larger share of their budgets on goods.
Harvard Business School’s Pricing Lab documented the differential impact across product categories. Between March and September 2025, the price of imported goods rose about 4.0 percent while domestic goods rose 2.0 percent. Categories showing especially steep increases include clothing accessories, jewelry, and household tools—items that feature prominently in household budgets.
How will Trump’s tax cuts affect the economy?
The Tax Foundation projects Trump’s One Big Beautiful Bill Act will reduce federal revenue by $5 trillion between 2025-2034, increasing long-run GDP by 1.2 percent. The Congressional Budget Office forecasts real GDP growth of 1.4% in 2025, rising to 2.2% in 2026 as tax provisions that reduce effective marginal rates on labor income boost work incentives and business investment accelerates.
The inflation impact exhibits a distinct timeline. J.P. Morgan estimates the announced measures could boost Personal Consumption Expenditures prices by 1–1.5% this year, and the inflationary effects would mostly be realized in the middle quarters of the year. This timing reflects the lag between tariff implementation and the pass-through to consumer prices as businesses work through existing inventories and negotiate new supply arrangements.
Fed Chair Jerome Powell emphasized this temporal dimension in his December press conference, noting that inflation from goods should peak in the first quarter or so assuming no major new tariff announcements. He characterized tariffs as likely to be relatively short lived, effectively a one time shift in the price level rather than an ongoing inflation problem.
This distinction—between a one-time price level increase and sustained inflation—matters profoundly for monetary policy. If Powell’s assessment proves correct, the tariff shock will fade from year-over-year inflation calculations by late 2026, allowing price pressures to normalize. But if tariffs trigger second-round effects through wage increases or inflation expectations becoming unanchored, the problem becomes more persistent.
The Federal Reserve’s Impossible Calculus
Perhaps no institution faces a more difficult navigation challenge than the Federal Reserve, which confronts simultaneous threats to both sides of its dual mandate: maximum employment and stable prices.
In December 2025, the Federal Open Market Committee lowered its key overnight borrowing rate by a quarter percentage point, putting it in a range between 3.5%-3.75%. But the decision was anything but unanimous—three members dissented, the highest number since September 2019. Governor Stephen Miran favored a larger half-point cut to support the weakening labor market, while Kansas City Fed President Jeffrey Schmid and Chicago Fed President Austan Goolsbee preferred holding rates steady out of inflation concerns.
This division reflects genuine uncertainty about the economy’s trajectory. The Congressional Budget Office projects the unemployment rate will rise from 4.1 percent at the end of 2024 to 4.5 percent by the end of 2025 and then fall to 4.2 percent by the end of 2026 as tax cut provisions that reduce effective marginal tax rates on labor income increase work incentives.
Powell acknowledged the bind directly: There’s no risk-free path for policy as we navigate this tension between our employment and inflation goals. If the Fed maintains elevated rates to combat tariff-induced inflation, it risks deepening labor market weakness. But if it cuts rates aggressively to support employment, it could validate higher inflation expectations and lose credibility.
The Committee’s latest economic projections show the committee continues to expect inflation to hold above its 2% target until 2028, a sobering assessment that reflects both tariff impacts and the stimulative effects of tax cuts on aggregate demand. For 2026, the Fed penciled in just one additional rate cut—a stark contrast with market expectations earlier in the year for more aggressive easing.
Powell repeatedly blamed tariffs for the inflation overshoot, stating that it is really tariffs that are causing most of the inflation overshoot. But he also stressed the Fed’s commitment to its mandate: Everyone should understand that we are committed to 2% inflation, and we will deliver 2% inflation.
The Fed finds itself in the uncomfortable position of having to look through supply-side price increases caused by tariffs while remaining vigilant that these don’t morph into broader inflation. Historical precedent from the 1970s oil shocks—when the Fed initially accommodated supply-driven inflation, only to face a far more painful disinflation later—weighs heavily on policymakers’ minds.
Net Economic Impact: Reading the Scorecard Through 2027
Synthesizing these opposing forces requires examining consensus forecasts from institutions with different methodological approaches. The picture that emerges shows near-term weakness giving way to moderate acceleration, but with considerable uncertainty bands.
The Congressional Budget Office, in projections released in September 2025, shows real GDP growth decreasing from 2.5% in 2024 to 1.4% this year. The downgrade from its January forecast reflects the negative effects on output stemming from new tariffs and lower net immigration more than offset the positive effects of provisions of the reconciliation act this year.
But 2026 tells a different story. CBO projects real GDP growth rises to 2.2 percent, reflecting the reconciliation act’s boost to consumption, private investment, and federal purchases and the diminishing effects of uncertainty about tariffs. The Federal Reserve Bank of Philadelphia’s Survey of Professional Forecasters, polling 33 economists, found consensus expectations of real GDP to grow at an annual rate of 1.9 percent in 2025 and 1.8 percent in 2026.
Goldman Sachs takes a more optimistic view in its 2026 outlook, forecasting 2.6% GDP growth driven by three factors: fading tariff impacts, tax cut stimulus (including an estimated $100 billion in additional tax refunds), and more favorable financial conditions from Fed rate cuts and deregulation initiatives.
On employment, the outlook remains mixed. The unemployment rate has drifted higher through 2025 as businesses navigate policy uncertainty around trade, immigration, and government downsizing. While the tax cuts’ labor supply incentives should support employment growth, the adjustment process takes time.
Real wage growth—nominal wage increases adjusted for inflation—represents perhaps the most important metric for household welfare. The CBO expects nominal wage growth to moderate but remain positive, while inflation gradually declines toward target. This implies modest real wage gains for workers, though the distribution varies significantly by income level and industry exposure to tariffs.
Corporate earnings present a sector-specific picture. Companies with primarily domestic operations and low import dependency benefit from both lower tax rates and reduced competition from foreign producers. The S&P 500 reached new highs in late 2025, reflecting optimism about tax-enhanced profitability. But retailers, manufacturers dependent on imported components, and export-oriented firms face margin compression from tariffs and potential foreign retaliation.
Winners, Losers, and the Distribution Question
No fiscal policy of this magnitude affects all Americans equally. The distributional consequences reveal important equity considerations that transcend partisan debates.
The Urban-Brookings Tax Policy Center analyzed the original 2017 tax cuts and found that the top 5% of earners would get 45% of the benefits if extended. While the 2025 legislation adds provisions like tip income deductions that benefit lower earners, the basic structure remains tilted toward higher-income households who pay the lion’s share of income taxes.
Consider the math for different household types. A single parent earning $45,000 annually receives modest benefit from the slightly higher standard deduction and child tax credit—perhaps $300-500 in reduced tax liability. A married couple earning $250,000 sees benefits exceeding $5,000 from bracket relief alone, before accounting for other provisions.
Meanwhile, tariff costs fall regressively. Lower-income households spend a larger share of their budgets on goods subject to tariffs—clothing, household items, electronics. The Tax Foundation’s estimate of $1,200-1,400 in average household costs masks wide variation: a $35,000 household loses 3-4% of purchasing power, while a $150,000 household loses 0.8-1%.
Industry and occupational groups face divergent fortunes. Domestic manufacturers without import dependencies—particularly in industries protected by tariffs—gain on multiple fronts: lower taxes, reduced foreign competition, and potentially higher prices. Construction workers benefit from permanent full expensing provisions that encourage building investment. Financial services firms profit from increased lending as businesses deploy tax savings.
Conversely, retailers dependent on imported goods face a squeeze. Major companies including Walmart and Dollar General have announced price increases as they pass costs to consumers. Consumer goods companies like Procter & Gamble, Kraft Heinz, and Conagra have announced they are raising prices as a result of tariff costs.
Geographic distribution matters too. High-tax states like New York, California, and New Jersey see residents benefit from the increased SALT deduction cap, raising the deduction to $40,000 from $10,000. But these states also contain concentrations of import-dependent businesses and price-sensitive consumers.
Global Ripples: Trade Partners React
America’s fiscal choices reverberate globally through multiple channels. The tariff regime has already triggered retaliatory measures from major trading partners. China, the EU, and others have implemented countermeasures targeting U.S. exports, with agriculture particularly vulnerable.
The Peterson Institute for International Economics models suggest the combined effect of U.S. tariffs and foreign retaliation could offset more than two-thirds of the long-run economic benefit of Trump’s proposed tax cuts. This underscores how trade policy can substantially erode the gains from pro-growth tax reform.
Currency markets have responded to the shifting policy mix. The dollar initially strengthened on expectations of higher growth and interest rates, but then by May 10, it had depreciated by 5 percent relative to most major currencies, reflecting concerns about fiscal sustainability and potential capital outflows.
For Europe, the impact manifests through reduced export demand and investment uncertainty. J.P. Morgan’s Raphael Brun-Aguerre noted that activity has been running at an annualized rate of 0.9% in the first half of 2025, and we expect activity to moderate in the second half of the year with a negative direct and indirect impact from tariffs.
Supply chain realignment represents perhaps the most significant long-term effect. Businesses are reassessing their global footprints, with many considering nearshoring to Mexico or friendshoring to allied nations. This restructuring involves substantial costs and takes years to fully implement, creating ongoing uncertainty that weighs on investment decisions.
Scenarios: Base, Bull, and Bear Cases
Given the interplay of tax cuts, tariffs, monetary policy, and unpredictable factors like geopolitical developments, economic forecasting requires scenario analysis with assigned probabilities.
Base Case (55% probability): Tax cuts drive GDP growth to 2.0-2.3% in 2026 after a sluggish 1.4-1.5% in 2025. Tariff inflation peaks in Q1 2026 around 3.5% (core PCE) before moderating to 2.4-2.6% by year-end. The Federal Reserve cuts rates modestly—two quarter-point reductions in 2026—while maintaining a cautious stance. Unemployment stabilizes around 4.3-4.5% as labor market adjusts. The combined deficit impact reaches approximately $3.4 trillion over a decade after accounting for tariff revenues and economic growth effects. Stock markets continue gradual appreciation on earnings growth, though volatility persists around policy announcements.
Bull Case (25% probability): Trade negotiations produce meaningful tariff rollbacks by mid-2026, reducing inflation pressures faster than expected. Tax cut stimulus exceeds consensus forecasts as business investment responds strongly to full expensing provisions. GDP growth reaches 2.6-2.8% in 2026, unemployment falls to 4.1%, and inflation returns to near-target by late 2026. The Fed cuts rates more aggressively—four reductions through 2026—as dual mandate tensions ease. Productivity gains from AI and technology adoption begin materializing. Fiscal costs come in lower than projected as dynamic revenue effects prove stronger. Markets rally 12-15% in 2026 on improving fundamentals.
Bear Case (20% probability): Tariffs escalate further with major retaliation from trading partners, pushing peak inflation to 4.5-5% in early 2026. Tax cuts fail to generate expected investment response as elevated uncertainty keeps businesses cautious. GDP growth stagnates at 1.0-1.3% through 2026, while unemployment rises to 4.8-5.0%. The Federal Reserve faces impossible tradeoff: cutting rates risks unanchoring inflation expectations, while holding firm deepens recession risk. Long-term interest rates spike as bond markets react to ballooning deficits, adding $725 billion in extra debt service over the decade. Markets correct 15-20% on stagflation concerns. Political gridlock prevents policy adjustments.
Timeline: Quarter-by-Quarter Roadmap
Q1 2026 (January-March): Peak tariff inflation pressure as businesses fully pass through costs accumulated in 2025. Core PCE inflation likely reaches 3.3-3.5%. Tax refund season delivers approximately $100 billion to households from 2025 provisions. Federal Reserve holds rates steady at January meeting, evaluating incoming data. Labor market shows early stabilization with unemployment around 4.4%. Congressional debates over deficit begin intensifying.
Q2 2026 (April-June): Inflation begins moderating as tariff base effects fade from year-over-year calculations. GDP growth accelerates to 2.3-2.5% annualized rate as tax cut stimulus gains traction and businesses complete inventory adjustments. Federal Reserve likely implements first rate cut of the year, signaling confidence that tariff inflation is transitory. Consumer spending strengthens on improved real wage growth. Housing market shows renewed activity on lower mortgage rates.
Q3 2026 (July-September): Economic picture clarifies with six months of post-tax-cut data. Inflation target of 2.5-2.7% core PCE suggests Fed successfully navigated dual mandate tensions. Business investment data reveals whether full expensing provisions are generating anticipated capital formation. Trade deficit trends indicate whether tariffs achieved administration’s rebalancing goals. Unemployment stabilizes around 4.2-4.3%.
Q4 2026 (October-December): Fed delivers potential second rate cut if inflation and labor market data cooperate. Markets begin pricing 2027 outlook. Congressional Budget Office releases updated 10-year projections incorporating actual policy effects. Financial markets assess whether deficit trajectory is sustainable. Holiday retail sales provide critical real-time indicator of consumer health.
Critical Indicators to Monitor
Several data points will provide early signals of which scenario is unfolding:
Monthly CPI and PCE Reports: Track month-over-month changes in core inflation, particularly goods categories most exposed to tariffs. Sequential deceleration would confirm Powell’s transitory thesis.
Employment Situation Reports: Beyond headline payroll numbers, watch labor force participation rates and real wage growth (nominal wages minus inflation). Strong participation suggests tax cuts are incentivizing work.
Business Investment Data: Equipment and intellectual property investment figures reveal whether companies are deploying tax savings productively or hoarding cash amid uncertainty.
Import/Export Prices: Leading indicators of tariff pass-through and retaliation effects. Stabilization would signal trade tensions easing.
Consumer Confidence Surveys: Forward-looking household sentiment about income prospects and inflation expectations.
Federal Reserve Minutes and Fed Speak: Watch for shifts in committee consensus about inflation persistence versus labor market fragility.
Long-term Treasury Yields: Bond market’s assessment of fiscal sustainability. Sustained moves above 4.5% on 10-year notes would signal deficit concerns.
The Fiscal Reckoning Ahead
Beyond 2026 lies a longer-term question that transcends the immediate growth-versus-inflation debate: fiscal sustainability. The CBO projects debt held by the public will rise from 100 percent of GDP in 2025 to 118 percent by 2035, exceeding any level in American history.
The One Big Beautiful Bill Act adds materially to this trajectory. On a dynamic basis—accounting for economic growth effects—the Tax Foundation estimates the OBBB would increase federal budget deficits by $3.0 trillion from 2025 through 2034, and increased borrowing would add $725 billion in higher interest costs over the decade.
This matters because bond markets have finite patience for fiscal expansion, particularly when growth expectations don’t justify borrowing levels. The experience of the United Kingdom in 2022, when ambitious tax cuts sparked bond market turmoil and forced policy reversal within weeks, serves as a cautionary tale.
The counter-argument holds that reasonable debt-to-GDP ratios depend on growth rates and borrowing costs. If tax cuts generate sustained productivity improvements and GDP growth remains above interest rates, the debt dynamics remain manageable. Proponents point to decades of fiscal space afforded by reserve currency status and deep capital markets.
What’s incontrovertible is that interest costs are rising rapidly as a share of the federal budget. This crowds out other spending priorities and reduces fiscal flexibility for future crises. The political economy challenge—how to address long-term fiscal imbalances when short-term incentives favor tax cuts and spending increases—remains unresolved.
What This Means for Stakeholders
For Households: The net effect depends critically on income level and consumption patterns. Higher earners with diversified investments and professional incomes gain unambiguously from tax cuts. Middle-income families see modest benefits that may be partially offset by tariff-driven price increases on goods. Lower-income households face challenging math: nominal tax benefits often prove smaller than real income erosion from inflation.
The prudent household strategy involves locking in lower borrowing costs where possible (refinancing mortgages, consolidating high-interest debt), building emergency savings to weather labor market volatility, and maintaining flexibility in spending patterns as relative prices shift.
For Businesses: The calculus varies dramatically by sector, import dependency, and customer base. Companies should scenario-plan across tariff persistence versus rollback, model cash flows under different Fed rate paths, and evaluate whether full expensing provisions justify accelerated capital investment. Supply chain diversification—while costly—may provide valuable optionality if trade policy remains volatile.
Service businesses with domestic operations benefit cleanly from tax cuts without significant tariff exposure. Manufacturers must weigh reduced tax rates against higher input costs. Retailers face margin compression that may require pricing power or operational efficiency gains to offset.
For Investors: Portfolio construction should account for regime change from the low-rate, low-inflation era. Fixed income faces ongoing repricing as long-term rates adjust to fiscal realities. Equity valuations near record highs embed optimistic assumptions about earnings growth that may not materialize if stagflation risks increase.
Sector rotation strategies favor domestically-oriented companies with pricing power and low import sensitivity. Technology companies face mixed signals: tax benefits and deregulation support valuations, but some face tariff headwinds on components and consumer electronics. Defensive sectors with inflation-linked revenues (utilities, real estate) may outperform if inflation persists above target.
For Policymakers: The challenge is navigating political economy constraints while addressing legitimate economic concerns. Tariffs provide visible action on trade imbalances but carry significant welfare costs. Tax cuts deliver tangible benefits to constituents but worsen long-term fiscal position.
The optimal policy package would likely involve targeted rather than universal tariffs, offsetting revenue losses from tax cuts with base-broadening reforms rather than deficit spending, and pairing near-term stimulus with credible long-term fiscal consolidation. Political realities make such packages difficult to assemble.
Conclusion: Threading the Needle
As 2026 unfolds, the U.S. economy faces an unusual combination of forces: aggressive fiscal stimulus colliding with trade-induced inflation, an uncertain monetary policy response, and longer-term fiscal clouds on the horizon. The most likely outcome—captured in the base case scenario—sees the tax cut tailwind eventually overcoming tariff headwinds after a bumpy first half, delivering moderate growth with inflation gradually returning toward target.
But the probability distribution is wide. Success requires multiple things going right simultaneously: tariffs causing only temporary inflation without second-round effects, tax cuts spurring productive investment rather than consumption or financial engineering, the Federal Reserve threading its dual mandate needle, and fiscal discipline emerging before bond markets force it.
History offers mixed lessons. Supply-side tax cuts in the 1980s coincided with strong growth but also soaring deficits and eventual tax increases. The 2017 tax cuts generated modest economic gains less dramatic than advertised. Tariff regimes—from Smoot-Hawley in the 1930s to more recent steel tariffs—typically impose welfare costs exceeding any protection benefits.
What’s different this time is scale and simultaneity. Never since World War II has the United States combined such aggressive fiscal expansion with trade barriers of this magnitude while starting from elevated debt levels and near-full employment. We are, in a meaningful sense, conducting a macroeconomic experiment in real time.
The most honest assessment acknowledges uncertainty while identifying mechanisms and monitoring signals. The tax cuts will boost after-tax incomes and may spur investment—that’s economically sound. Tariffs will raise prices and distort resource allocation—that’s equally certain. The Federal Reserve can manage one-time price level shifts if inflation expectations remain anchored—that’s theoretically correct but operationally challenging.
For businesses and households, the prudent response involves flexibility: maintaining liquidity, diversifying risk, and avoiding bets that require a specific policy outcome. For policymakers, it demands intellectual honesty about tradeoffs, responsiveness to incoming data, and willingness to adjust course if outcomes diverge from forecasts.
The U.S. economy enters 2026 with considerable underlying strength: dynamic businesses, flexible labor markets, technological leadership, and resilient consumers. The question is whether policy choices harness these strengths or create headwinds that offset them. The answer will emerge quarter by quarter through 2026, providing lessons for generations of economists and policymakers to study.
One thing seems certain: the debate over whether tax cuts or tariffs represent sound economic policy will continue long after we know which forecast proved most accurate. What matters now is clear-eyed analysis of facts as they emerge, rigorous assessment of competing interpretations, and humility about the limits of economic prediction in a complex, dynamic system.
The economy is about to tell us which story is correct. We should listen carefully to what it says.


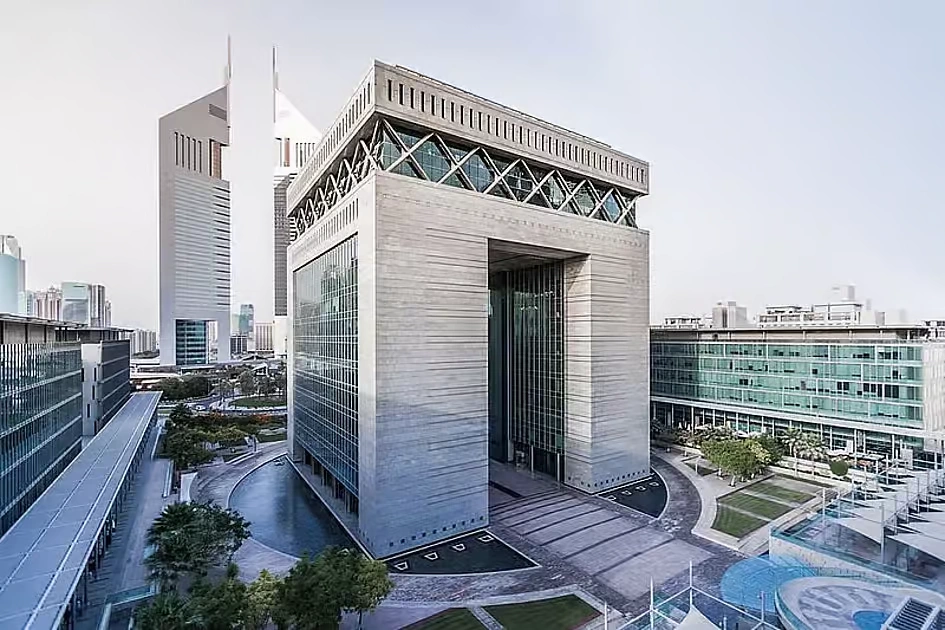
Dubai has climbed to its highest position ever on one of finance’s most closely watched rankings, and the achievement is no accident — it is the direct output of a decade-long, numerically explicit government strategy that few other financial centres have attempted to execute with this level of precision.
The Ranking Itself
The Dubai International Financial Centre has recorded its highest-ever position on the Global Financial Centres Index at seventh place worldwide, the highest ranking ever achieved by any financial centre across the Middle East, Africa and South Asia region, and the only MEASA-region centre to feature in the global top 20 — underscoring both its regional dominance and genuine global competitiveness.
The D33 Strategy Behind the Number
The ranking is explicitly tied to Dubai’s own stated ambitions. The GFCI result is described as pivotal to Dubai’s goal of becoming one of the world’s top four financial centres by 2033, in line with the Dubai Economic Agenda, or D33, which targets a doubling of the emirate’s economy over the decade. Separately, Dubai Chambers has confirmed the plan targets cumulative economic output of AED 32 trillion, or roughly $8.7 trillion, over the decade, supported by 100 transformative projects centred on trade expansion, digital innovation and sustainable growth.
The Underlying Economic Engine
The financial-centre ambitions are backed by genuine current-quarter growth. Dubai’s economy reached AED 232 billion in first-quarter 2026 GDP, a 2.4 percent year-on-year increase, with the finance, construction, healthcare, wholesale and retail trade, and real estate sectors all contributing to the broad-based expansion. Middle East Briefing separately projects the wider UAE economy will expand around 5 percent in 2026, with local banks positioned to increase lending both domestically — supporting SMEs, consumers and project finance — and across borders into markets like Saudi Arabia, where UAE banks’ comparatively lower interbank rates create an arbitrage opportunity.
Real Money Behind the Ranking
The GFCI climb is being validated by tangible transaction volume rather than sentiment alone. Weekly UAE business tracking shows a steady drumbeat of institutional activity: Sharjah Islamic Bank reported AED 803.9 million in net profit, up 15.3 percent, ADI Chain secured a $50 million investment to build sovereign digital infrastructure, and Capital.com reported $1.1 trillion in second-quarter trading volume routed through the jurisdiction. Separately, UAE and Saudi banks are projected to lead GCC credit growth in 2026, reinforcing Dubai and Abu Dhabi’s combined position as the region’s default financial gateway.
Why This Matters for Pakistan and South Asia
Dubai’s ascent as a financial hub carries direct relevance for Pakistan, where — as detailed in our companion coverage of Pakistan’s remittance exposure — roughly 55 percent of the country’s substantial remittance inflows originate from the Gulf Cooperation Council. A deepening, increasingly sophisticated DIFC-anchored financial ecosystem in Dubai means more efficient, lower-cost channels for that capital, alongside growing opportunities for Pakistani and South Asian firms to access GCC-sourced project finance and cross-border credit as UAE banks expand lending beyond their domestic market.
What is Dubai’s global financial centre ranking in 2026?
Dubai’s DIFC recorded its highest-ever ranking on the Global Financial Centres Index at 7th place worldwide in 2026 — the highest ever achieved by any Middle East, Africa or South Asia financial centre — as part of its stated goal to become a top-four global financial hub by 2033.
The Risk Beneath the Growth Story
Not every signal points to unambiguous strength. AGBI’s own reporting notes that UAE banks’ second-quarter results are likely to show weaker profits, slower lending and narrower margins, even as analysts characterise the underlying sector as fundamentally resilient — a reminder that Dubai’s financial-hub ambitions are being pursued against a genuinely more difficult regional operating environment shaped by the Strait of Hormuz disruption and broader Gulf security concerns, not in isolation from them.
The Bottom Line
Dubai’s climb to seventh in the GFCI rankings is less a one-off achievement than a measurable checkpoint on an explicitly numbered, decade-long strategic roadmap — one increasingly backed by real GDP growth, credit expansion, and institutional trading volume rather than ambition alone.
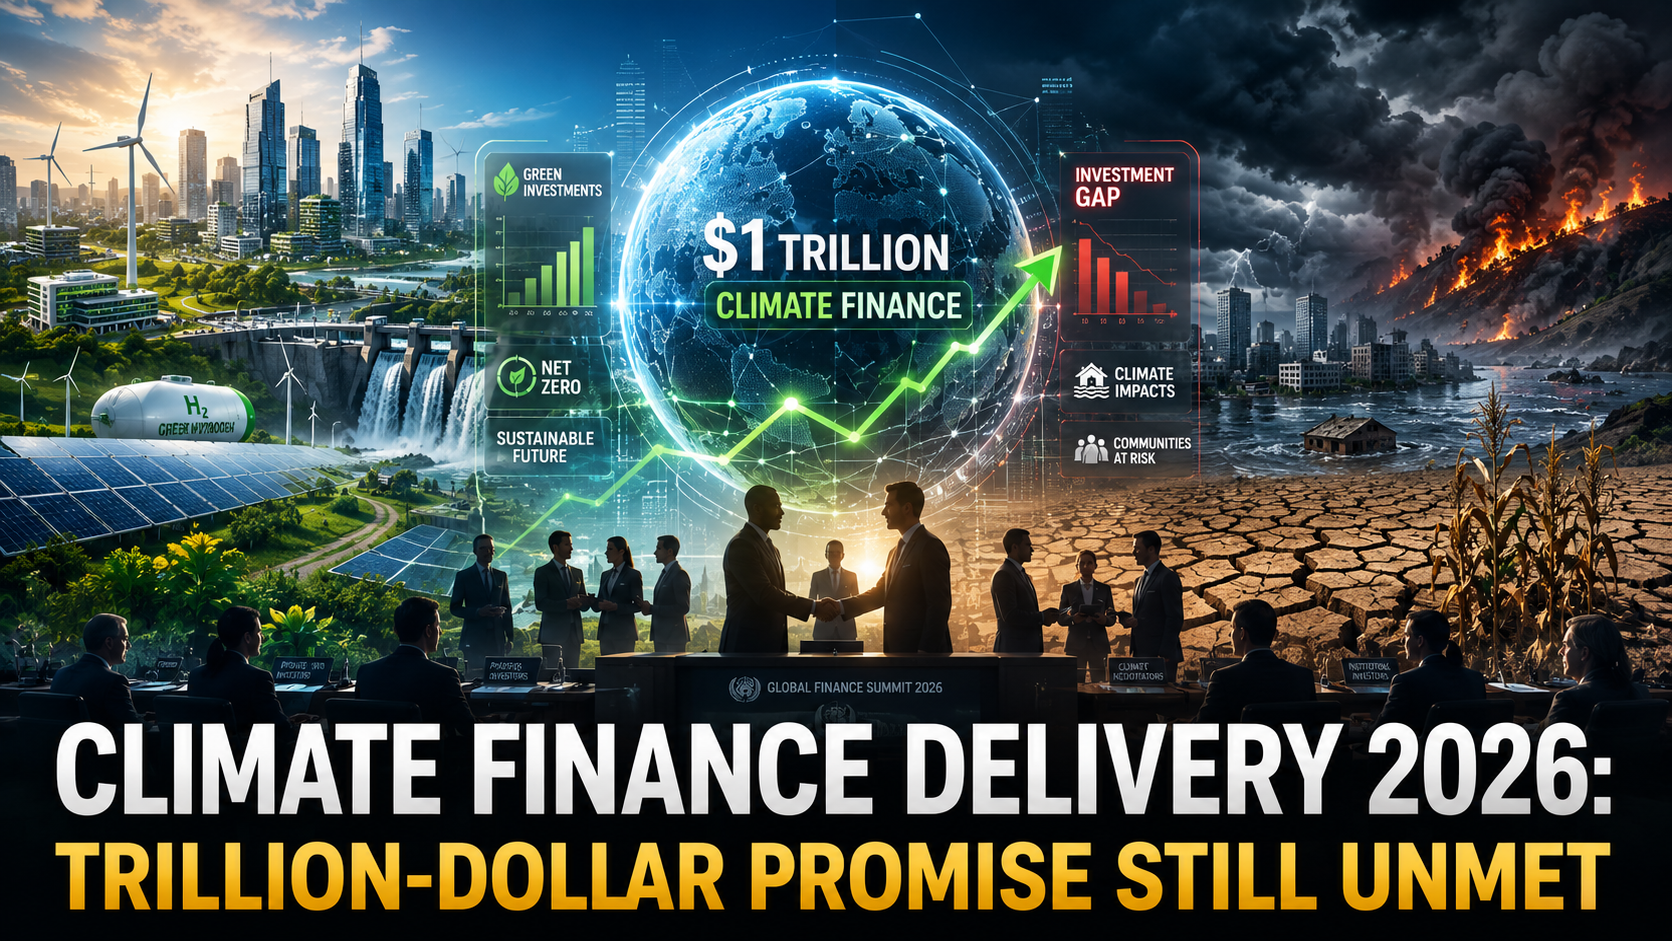
Rich Nations Face Make‑or‑Break Moment at COP31 Preparatory Talks
The United Nations Framework Convention on Climate Change (UNFCCC) has released a sobering assessment: climate finance delivery 2026 remains a staggering $1.1 trillion short of the $2.4 trillion that developing countries need annually to transition to low‑carbon economies and adapt to climate impacts (UNFCCC Standing Committee on Finance, June 2026). The report, published ahead of the pre‑COP31 ministerial in Bonn, reveals that total climate finance flows reached $1.3 trillion in 2024 (the latest available data), virtually flat from 2023. While the number is a record in absolute terms, the chasm between what is provided and what is needed is widening, not narrowing.
The Structure of the Shortfall
The $2.4 trillion annual need is broken down into three components: $1.2 trillion for mitigation (clean energy, industry decarbonisation), $800 billion for adaptation (sea walls, drought‑resilient crops, early warning systems), and $400 billion for loss and damage (compensation for unavoidable climate impacts). Currently, mitigation receives the lion’s share of finance—over 85%—mostly in the form of loans that add to debt burdens. Adaptation, which is most critical for the poorest countries, receives only $130 billion, and loss and damage, despite the operationalisation of a dedicated fund at COP28 in 2023, has seen a mere $2 billion in pledges against the $400 billion ask.
The loss and damage fund, a hard‑won victory for vulnerable nations, is emblematic of the gap between rhetoric and reality. Rich countries have committed just 0.5% of what the UNFCCC secretariat estimates is required for countries like Pakistan (2022 floods), Vanuatu (cyclones), and the Sahel (desertification) to rebuild in a climate‑resilient manner. The World Bank, which hosts the fund, has been slow to disburse, and the US, historically the largest historical emitter, has contributed only $500 million, a fraction of its fair share (World Bank Loss and Damage Fund Update, June 2026).
The NCQG Negotiations: Who Pays?
The NCQG negotiations (new collective quantified goal on climate finance) are the central battlefield of COP31, scheduled for November 2026 in Brasília. The current goal, set at COP15 in 2009, was $100 billion a year by 2020—a target met only in 2022. The new goal must reflect the drastically increased needs and a broader donor base. The EU and the US are insisting that China, now the world’s largest emitter and the second‑largest economy, must become a formal contributor, arguing that the 1992 division of the world into “Annex I” (developed) and “non‑Annex I” (developing) is outdated. China and the G77+China grouping counter that historical responsibility and per‑capita emissions still place the primary obligation on the old industrial powers.
The deadlock has been partially broken by a bridging proposal from the COP31 presidency (Brazil) that would create a three‑tiered system: Tier 1 contributors (traditional donors) would provide grants and concessional finance; Tier 2 contributors (high‑income developing countries like China, Saudi Arabia, Singapore) would provide non‑concessional loans and technology transfer; and Tier 3 contributors (multilateral development banks) would leverage their balance sheets to mobilise private capital. The proposal would set a cumulative target of $1.5 trillion a year by 2030, but the tiers’ shares remain hotly contested (UNFCCC, Pre‑COP31 Ministerial Draft Text, June 2026).
Mobilising Private Finance: The MDB Reform Agenda
Given the fiscal constraints in donor countries, the real engine of increased climate finance must be the multilateral development banks (MDBs) and the private sector. The World Bank, under its new president, has implemented the recommendations of the G20 Capital Adequacy Framework review, which could unlock an additional $100 billion in lending headroom over a decade without requiring new capital. The Bank is launching a new “Climate Enhanced” bond, where coupon payments are linked to verified emission reduction outcomes in a portfolio of African clean‑cooking and reforestation projects, targeting institutional investors hungry for impact‑linked returns (World Bank, Outcome Bond Issuance, June 2026).
The International Finance Corporation is expanding its “Green Up” guarantee facility, which de‑risks private investments in emerging‑market renewable energy by covering first‑loss risks. The Glasgow Financial Alliance for Net Zero (GFANZ) has evolved from a coalition of pledges to a set of country‑specific investment platforms: in Vietnam, a Just Energy Transition Partnership has mobilized $15 billion, and in Senegal, a similar platform is targeting $5 billion for solar and green hydrogen. These vehicles blend public concessional capital with private investment, but scaling them to the $2.4 trillion level remains aspirational.
The Cost of Inaction
The UNFCCC report emphasizes that every year of underfunding magnifies the eventual bill. The cost of inaction—measured in destroyed infrastructure, lost crop yields, and health crises—is accelerating. Swiss Re estimates that unabated climate change could reduce global GDP by 11% by 2050 (Swiss Re Institute, “Climate Economics”, 2026). For the private sector, climate risk is already material: supply chains are being disrupted by floods in Bangladesh and droughts in Panama, and insurance coverage is retreating from vulnerable regions, leaving assets stranded. The business case for closing the climate finance gap is not charitable; it is self‑interest.
The pre‑COP31 talks in Bonn are being described by veteran negotiators as the most consequential since Copenhagen 2009. The outcome will determine whether the Paris Agreement’s 1.5°C target remains within reach. The message from the UNFCCC is unambiguous: the world’s financial architecture is not fit for purpose in the face of a climate emergency, and the window for reform is closing fast.

The Asian Development Bank (ADB) has formally approved a landmark $700mn loan for Pakistan’s insurance sector, signaling an aggressive attempt to fortify the country’s fragile financial architecture against systemic climate and economic shocks. Signed in Islamabad by regional directors, the capital injection arrives at a delicate moment for the South Asian nation. With domestic insurance penetration languishing at historic lows, this massive facility represents more than a simple fiscal cushion. It is a legally binding blueprint designed to restructure how risk is priced, managed, and mitigated across one of the least developed financial markets in Asia.
Pakistan’s macroeconomic situation remains precarious. While recent agreements with the International Monetary Fund have temporarily stabilized foreign exchange reserves, structural vulnerabilities run deep. The country remains exceptionally exposed to environmental catastrophes. The devastating floods of 2022, for instance, caused over $30 billion in economic damage, yet less than 2% of those losses were covered by commercial insurance policies, according to data from the World Bank.
This lack of a domestic safety net forces the federal government to rely heavily on emergency deficit spending, worsening an already critical public debt burden. The domestic insurance sector has historically failed to expand beyond basic corporate coverage and mandatory automotive policies. By injecting capital directly into regulatory reform and market modernization, this new multilateral program intends to build a self-sustaining risk ecosystem that reduces the state’s direct liability when the next inevitable crisis hits.
The Asian Development Bank program is structured around three core pillars managed alongside the Securities and Exchange Commission of Pakistan (SECP). On October 14, 2025, initial program drafts detailed that the initial $300 million tranche will focus immediately on legislative overhauls. This includes updating the Insurance Ordinance of 2000 to align with international risk-based capital models. By forcing domestic firms to maintain capital reserves proportional to their actual underwriting risk, the regulator hopes to weed out insolvent operators and build institutional trust.
The remaining $400 million is tied to developing specialized market infrastructure. A primary objective is the creation of a national catastrophe reinsurance pool, which will distribute large-scale agricultural and infrastructure risks across international markets. Data from the Asian Development Bank reveals that current domestic reinsurance capacity cannot support even 10% of Pakistan’s commercial property assets. This shortfall forces local insurers to pass expensive premiums onto small businesses or avoid writing disaster policies altogether.
Furthermore, the loan introduces strict digital transformation mandates. Under the supervision of SECP Chairman Akif Saeed, domestic insurance companies will be required to build open-API architectures. This technological shift will enable mobile microinsurance platforms to reach rural populations. Currently, over 80% of Pakistan’s agricultural workforce operates entirely outside the formal banking system. Bringing these citizens into the financial fold via digital crop and health insurance is vital for long-term stability.
The capital will also support the modernization of the state-owned National Insurance Company Limited (NICL). Long criticized for administrative inefficiencies, NICL will undergo a complete digital audit to streamline claims processing. The goal is to reduce the average claim settlement time from nine months down to less than thirty days, setting a new operational benchmark for the private sector to follow.
To ensure compliance, the Ministry of Finance will establish a dedicated oversight committee. This body will publish quarterly progress reports on fund utilization, directly matching benchmarks set by the Securities and Exchange Commission of Pakistan. This level of transparency aims to reassure external bondholders that the funds are driving deep structural change rather than merely patching short-term fiscal deficits.
Pakistan Financial Sector Reforms
Moving beyond the immediate mechanics of the loan, the structural intervention reveals a deeper macroeconomic reality. Multilateral lenders are shifting away from general budgetary support toward targeted financial market interventions. The choice to focus heavily on insurance highlights a recognition that traditional banking sector liquidity cannot solve long-term capital scarcity. Without a functioning insurance market, local commercial banks remain hesitant to extend long-term credit for infrastructure or industrial expansion.
Why does Pakistan’s insurance sector require structural reform?
Pakistan’s insurance sector requires structural reform because its penetration rate sits below 1% of GDP, leaving the population exposed to macroeconomic and climate shocks. Outdated regulatory frameworks, low consumer trust, and insufficient capitalization prevent domestic insurers from absorbing large-scale commercial risks or offering viable microinsurance products.
This low penetration rate creates a dangerous loop. Because the domestic market is small, international reinsurers charge a premium to cover Pakistani risks. This keeps insurance costs prohibitively high for small and medium-sized enterprises (SMEs). According to a report by the Organization for Economic Co-operation and Development, economies with insurance penetration rates above 3% recover from economic shocks nearly three times faster than those dependent on ad-hoc state aid.
To contextualize Pakistan’s position relative to its regional peers, the stark divergence in financial depth becomes obvious when looking at insurance penetration across South Asia:
| Country | Insurance Penetration (% of GDP) | Primary Regulatory Model | State-Owned Market Share |
| India | 4.2% | Risk-Based Capital | Moderate (~40%) |
| Sri Lanka | 1.2% | Solvency II Equivalent | Low (~15%) |
| Bangladesh | 0.55% | Fixed Capital | High (~60%) |
| Pakistan | 0.91% | Solvency I (Outdated) | High (~50%) |
The structural overhaul also targets the core asset allocation of Pakistani insurance companies. Historically, domestic insurers have parked up to 85% of their premium reserves in low-yielding government bonds. While this strategy offers safe returns, it deprives the private sector of vital investment capital. The new risk-based capital framework will incentivize insurance firms to diversify their portfolios into corporate debt, venture funds, and green infrastructure bonds, fundamentally altering the flow of liquidity throughout the wider economy.
This portfolio diversification is expected to unlock roughly $1.5 billion in private sector investment over the next five years. By shifting away from sovereign debt, insurance companies will finally begin functioning as true institutional investors. This transition is critical for deepening Pakistan’s capital markets and reducing the corporate sector’s reliance on expensive, short-term commercial bank loans.
The downstream consequences of this capital injection will reshape the landscape of climate risk mitigation finance across South Asia. As climate patterns become increasingly erratic, the financial burden of rebuilding public infrastructure cannot rest solely on the national budget. By establishing a formalized framework for catastrophe bonds and weather-indexed insurance, Pakistan is laying the groundwork for private capital to absorb environmental risks.
For local businesses and agricultural operators, the rollout of inclusive insurance growth initiatives will alter daily operations. Consider a typical farmer in the Punjab region. Under the current system, a single season of erratic monsoon rainfall can result in total financial ruin, forcing the liquidation of assets and long-term poverty. Introducing reliable, low-cost crop insurance creates an economic floor, ensuring that families can purchase seeds and fertilizer for the following season regardless of weather outcomes.
On a macro scale, this shift stabilizes consumer demand and maintains rural purchasing power during downturns. The Financial Stability Board has consistently pointed out that unmitigated environmental risks pose a direct threat to banking stability. When agricultural yields collapse, non-performing loans spike across rural banking networks. By insulating farmers, the insurance sector acts as a shock absorber for the entire financial network.
Furthermore, international credit rating agencies monitor these developments closely. When agencies like Moody’s or Fitch assess Pakistan’s sovereign credit rating, the lack of disaster risk financing has historically acted as a significant negative factor. Demonstrating a structured, well-capitalized insurance mechanism lowers the country’s overall risk profile. Over time, this improvement can lower borrowing costs for both the state and private corporations looking to access international bond markets.
Private equity firms are already taking note of these regulatory changes. Several regional financial technology startups have initiated talks with local partners to launch dedicated insurtech apps. These ventures aim to capitalize on Pakistan’s high mobile penetration rate, transforming insurance from an elite corporate luxury into an accessible, everyday retail product for millions of previously unserved citizens.
Debt-Funded Financial Reforms
While the program’s objectives are ambitious, critics argue that loading another $700 million in foreign-currency debt onto Pakistan’s balance sheet carries profound risks. The country’s external debt obligations already consume a massive portion of its annual tax revenues. Some independent analysts suggest that using dollar-denominated loans to fund long-term domestic institutional adjustments creates a dangerous currency mismatch. If the Pakistani rupee depreciates significantly against the US dollar over the next decade, the cost of servicing this loan could vastly outweigh the economic benefits generated by the insurance sector.
The picture is more complicated when examining institutional capacity. Passing progressive legislation is simple compared to enforcing it across a resistant financial sector. Many smaller, family-owned insurance firms may lack the technical capabilities or capital depth to comply with the new risk-based guidelines. Forcing these entities into rapid compliance or liquidation could lead to market consolidation, reducing competition and leaving consumers with fewer choices and higher premiums.
Furthermore, skeptics point to the historical track record of state-led modernization schemes in Pakistan. Previous attempts to reform public enterprises have frequently stalled due to political interference and bureaucratic inertia. Without sustained political will and total regulatory independence for the SECP, there is a legitimate concern that these funds could be absorbed by administrative overhead rather than driving meaningful market change.
To mitigate these structural risks, external auditors must be given absolute authority to halt tranche releases if specific, pre-negotiated operational milestones are missed. Reliance on internal progress metrics has failed past reform programs, making independent verification a vital prerequisite for this initiative’s long-term success.
The ADB’s $700 million program is an unhedged bet on the transformative power of regulatory modernization. It attempts to address a fundamental structural vulnerability that has left Pakistan’s population and economy exposed to escalating macroeconomic and environmental shocks. Success will not be measured by the speed at which the capital is disbursed, but by whether the SECP can successfully build a competitive, well-capitalized marketplace that earns public trust.
If executed correctly, this initiative will provide Pakistan with the financial shock absorbers necessary to withstand future crises without relying on emergency bailouts. If it fails, it will simply become another line item on an already unsustainable national debt ledger. The coming years will determine whether this capital injection marks the birth of a resilient domestic risk market or stands as a costly reminder of the limits of debt-funded institutional engineering.
Building economic resilience requires structural foundations capable of outlasting temporary political cycles.

Pakistan’s Remittance Lifeline: Why Gulf Exposure Is a Hidden Risk

Dubai’s Rise to the World’s 7th Financial Hub: Inside the D33 Push

China EV Exports Hit Record High in 2026

UK’s “National Contributions Tax” Explained: Burnham-Era Reform 2026

Russia’s Strange Problem in 2026: Its Currency Is Too Strong

Section 301 Forced Labor Tariffs 2026: 60 Countries Affected

UK National Contributions Tax: Burnham’s Radical Tax Plan

Global Central Bank Divergence 2026: Why the Fed, BoE, BoJ, and PBoC Are All Moving Differently

Japan’s Bond Market Just Cracked. It Could Take the Rest of the World’s Debt With It

Malaysia’s Ringgit Is Holding Up. Economists Say the Real Test Is Still Coming

Climate Finance Delivery 2026: Trillion‑Dollar Promise Still Unmet

AI Impact on Wages 2026: Productivity Soars, Paychecks Stagnate

SpaceX IPO 2026: $2 Trillion AI Bubble, OpenAI & Anthropic — What Investors Must Know

China Economy 2026: Property Crisis, AI Investment & Export Surplus Explained

Top 15 Stocks for Investment in 2026 in PSX: Your Complete Guide to Pakistan’s Best Investment Opportunities
Top 15 Stocks for Investment in 2026 in PSX: Your Complete Guide to Pakistan’s Best Investment Opportunities

Debunking IMF Program Myths: Reconfiguring Engagement for True National Ownership in a Volatile World

Top 10 Mutual Fund Managers in Pakistan for Investment in 2026: A Comprehensive Guide for Optimal Returns

What the U.S. Attack on Venezuela Could Mean for Oil and Canadian Crude Exports: The Economic Impact

China’s 50% Domestic Equipment Rule: The Semiconductor Mandate Reshaping Global Tech

15 Most Lucrative Sectors for Investment in Pakistan: A 2025 Data-Driven Analysis

Pakistan’s Export Goldmine: 10 Game-Changing Markets Where Pakistani Businesses Are Winning Big in 2025
15 Most Lucrative Sectors for Investment in Pakistan: A 2025 Data-Driven Analysis
15 Most Lucrative Sectors for Investment in Pakistan: A 2025 Data-Driven Analysis

Pakistan’s Economic Outlook 2025: Between Stabilization and the Shadow of Stagnation
Pakistan’s Economic Outlook 2025: Between Stabilization and the Shadow of Stagnation

China’s Property Woes Could Last Until 2030—Despite Beijing’s Best Censorship Efforts
China’s Property Woes Could Last Until 2030—Despite Beijing’s Best Censorship Efforts
-
 Markets & Finance7 months ago
Top 15 Stocks for Investment in 2026 in PSX: Your Complete Guide to Pakistan’s Best Investment Opportunities
-
Markets & Finance7 months ago
Top 15 Stocks for Investment in 2026 in PSX: Your Complete Guide to Pakistan’s Best Investment Opportunities
-
 Analysis6 months ago
Debunking IMF Program Myths: Reconfiguring Engagement for True National Ownership in a Volatile World
-
 Investment6 months ago
Top 10 Mutual Fund Managers in Pakistan for Investment in 2026: A Comprehensive Guide for Optimal Returns
-
 Global Economy7 months ago
What the U.S. Attack on Venezuela Could Mean for Oil and Canadian Crude Exports: The Economic Impact
-
 Asia7 months ago
China’s 50% Domestic Equipment Rule: The Semiconductor Mandate Reshaping Global Tech
-
 AI7 months ago
15 Most Lucrative Sectors for Investment in Pakistan: A 2025 Data-Driven Analysis
-
 Exports7 months ago
Pakistan’s Export Goldmine: 10 Game-Changing Markets Where Pakistani Businesses Are Winning Big in 2025