
Asia
Pakistan’s Growth Outlook Dims: Why the IMF’s Latest Cut to 3.2% Matters for 2026 and Beyond

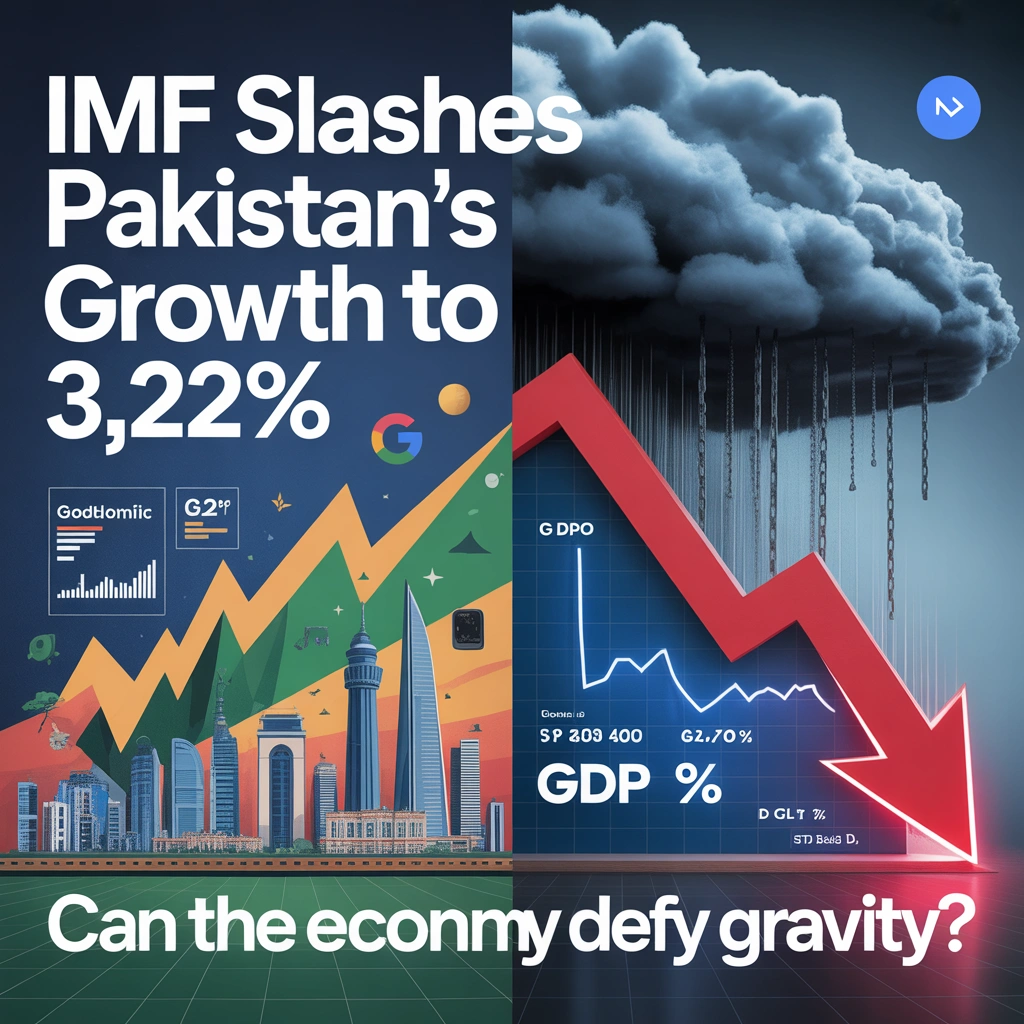
Pakistan has witnessed many ups and downs in its economic oulook . The latest IMF Cut is an eye-opener for all . This tension crystallized in late January 2026 when the International Monetary Fund, in its closely watched World Economic Outlook Update titled “Global Economy: Steady Amid Divergent Forces,” downgraded Pakistan’s GDP growth projection for the current fiscal year (FY2026, running July 2025–June 2026) from 3.6% to 3.2%. The revision—subtle in numerical terms but significant in trajectory—reflects mounting headwinds that differentiate Pakistan’s recovery from the global economy’s steadier path and regional peers’ stronger rebounds. While the IMF projects world growth at 3.3% in 2026 and 3.2% in 2027, buoyed by artificial intelligence investment and resilient consumer spending in advanced economies, Pakistan’s outlook reveals a nation struggling to translate macroeconomic stabilization into broad-based expansion.
Understanding why the IMF trimmed expectations—and why the gap between government targets and multilateral forecasts persists—requires examining not just Pakistan’s immediate fiscal and monetary constraints, but the deeper structural forces shaping emerging markets in an era of technological divergence, climate vulnerability, and geopolitical realignment.
The IMF’s Revised Numbers: What Changed and Why It Matters
The January 2026 downgrade represents the IMF’s third adjustment to Pakistan’s near-term outlook in six months. In October 2025, the Fund had projected 3.6% growth for FY2026, itself a modest upgrade from earlier 3.4% estimates following Pakistan’s successful completion of a $3 billion Stand-By Arrangement and entry into a new $7 billion Extended Fund Facility program. Now, at 3.2%, the projection sits uncomfortably below both the government’s optimistic 4.2% target and even the World Bank’s more conservative 3.4% estimate for FY2026-27.
The IMF’s medium-term trajectory shows similarly tepid expansion: 3.0% for calendar year 2025, 3.2% for 2026, rising to just 4.1% by 2027. For context, Pakistan averaged 5.5% annual growth during 2003–2007, and even the crisis-prone 2008–2018 decade saw average expansion near 3.8%. The current projections suggest Pakistan will underperform its own historical potential for at least another three years—a sobering reality for a nation of 240 million where demographic dividends demand growth rates closer to 6–7% to absorb new labor market entrants and reduce poverty meaningfully.
What prompted the downward revision? The IMF’s public commentary emphasizes three factors: weaker-than-expected agricultural output following irregular monsoons, slower credit growth to the private sector despite monetary easing, and persistent energy sector circular debt constraining industrial activity. Unpacking these reveals interconnected challenges that stabilization programs alone cannot resolve.
Table 1: Pakistan GDP Growth Projections Comparison (Percent)
| Source | FY2025 | FY2026 | FY2027 |
|---|---|---|---|
| IMF (January 2026) | 3.0 | 3.2 | 4.1 |
| World Bank (December 2025) | 3.0 | 3.4 | — |
| Pakistan Government | 3.5 | 4.2 | 5.0 |
| National Accounts Committee (actual FY2025) | 3.09 | — | — |
The divergence between official targets and multilateral forecasts isn’t mere technocratic disagreement—it reflects fundamentally different assumptions about reform implementation speed and external financing availability. Pakistan’s government builds budgets assuming 4–5% growth to meet revenue targets and debt service obligations; lower actual growth creates fiscal slippage, requiring either spending cuts or higher borrowing, which further constrains growth. This negative feedback loop has characterized Pakistan’s economy for much of the past decade.
Global Backdrop: Divergent Forces and Pakistan’s Positioning
The IMF’s broader January 2026 outlook paints a global economy managing surprising resilience despite headwinds. World growth projections were revised slightly upward—from 3.2% to 3.3% for 2026—driven primarily by what the Fund terms “AI-powered investment momentum” in the United States and parts of Asia. American business investment in data centers, chip manufacturing, and AI infrastructure has exceeded expectations, while consumption remains robust despite elevated interest rates. China’s economy shows tentative stabilization near 4.5% growth as property sector adjustments moderate and manufacturing exports hold steady.
Yet the report’s subtitle—”Steady Amid Divergent Forces”—captures crucial heterogeneity. Advanced economies benefit from productivity-enhancing technologies and deep capital markets that fund innovation; emerging markets face tightening credit conditions, commodity price volatility, and rising debt service costs. Trade policy uncertainty, particularly around U.S. tariff proposals and European Union carbon border adjustments, creates additional turbulence for export-dependent developing nations.
Pakistan sits uncomfortably in this divide. Unlike India, which attracts AI and semiconductor investment as part of global supply chain diversification, or Vietnam and Bangladesh, which have absorbed textile and electronics orders shifting from China, Pakistan struggles to position itself in reconfiguring trade networks. The country’s export basket remains dominated by low-value textiles and agricultural products, vulnerable to both price competition and climate shocks. Meanwhile, import dependence on energy and industrial inputs means Pakistan often grows fastest when its current account deficit widens dangerously—a pattern that has triggered repeated balance-of-payments crises.
The AI boom illustrates this divergence starkly. While Microsoft, Google, and regional champions invest tens of billions in Indian AI research centers and data infrastructure, Pakistan’s tech sector—though talented—lacks the regulatory clarity, digital infrastructure, and access to patient capital needed to participate meaningfully. Energy unreliability alone makes Pakistan an unlikely data center destination. The result: Pakistan watches from the sidelines as technological transformation reshapes competitive advantages globally.
Comparative Analysis: Why Forecasts Diverge
The gap between the government’s 4.2% FY2026 target and the IMF’s 3.2% projection merits deeper examination. Pakistan’s planning ministry bases optimistic scenarios on several assumptions: successful agricultural recovery to 3.5% growth (from 1.1% in FY2025), industrial sector expansion to 4.8% (from 2.8%), and services accelerating to 4.5% (from 3.9%). These assume normal weather, uninterrupted energy supply, and Chinese investment inflows through the China-Pakistan Economic Corridor (CPEC) revival.
The IMF’s skepticism rests on track records. Agriculture depends on monsoon patterns increasingly disrupted by climate change; Pakistan’s water storage capacity—just 30 days versus 120+ in peer countries—offers minimal buffer against rainfall variability. Industry faces structural constraints: the energy circular debt exceeds $2.5 billion and rising, while capacity payments to idle power plants drain fiscal resources without supporting production. Services growth, though relatively resilient, depends partly on remittance-fueled consumption that slows when Gulf employment opportunities contract or exchange rate volatility discourages informal transfers.
Regional comparisons sharpen the picture. India’s economy is projected to grow 6.5% in FY2026, driven by infrastructure investment, digital service exports, and manufacturing diversification. Bangladesh targets 6.0%+ growth as garment exports recover and renewable energy projects expand capacity. Even Sri Lanka, emerging from sovereign default just two years ago, projects 3.5% growth with IMF support. Pakistan’s 3.2% forecast places it in the bottom quartile of South Asian performers—a reversal from the 1990s when it often matched or exceeded regional averages.
What explains Pakistan’s relative underperformance? Three factors stand out. First, debt sustainability concerns constrain fiscal space; Pakistan’s public debt-to-GDP ratio near 75% and external debt service absorbing 35–40% of export earnings leaves minimal room for growth-supporting public investment. Second, political uncertainty—including judicial-political confrontations and civil-military tensions—deters private investment and complicates reform implementation. Third, structural reforms essential for productivity growth—energy market liberalization, export competitiveness restoration, human capital development—advance slowly or stall amid vested interest opposition.
The National Accounts Committee’s data provides a reality check. Actual FY2025 growth of 3.09% undershot both government projections (3.5%) and initial IMF estimates (3.3%), while Q1 FY2026 expansion at 3.71% reflected base effects and agricultural recovery rather than broad-based momentum. Manufacturing output remains below pre-pandemic levels, and construction activity—a bellwether for confidence—stagnates.
Underlying Drivers and Risks: Beyond the Headlines
Pakistan’s growth challenge reflects interlocking constraints that stabilization programs address incompletely. Consider the energy sector paradox. Pakistan has installed generation capacity exceeding peak demand—roughly 42,000 MW versus 30,000 MW peak load. Yet daily power cuts disrupt manufacturing, and circular debt balloons because distribution losses (technical and theft-related) exceed 17%, while tariff levels remain politically difficult to adjust to cost-recovery levels. The government pays $3+ billion annually in capacity payments to independent power producers for electricity not generated or not paid for—a fiscal hemorrhage that crowds out education and infrastructure spending.
Debt dynamics compound constraints. Pakistan’s external debt service obligations average $25 billion annually through 2027, requiring continuous IMF engagement and bilateral rollovers from China, Saudi Arabia, and the UAE to avoid default. This “bailout cycle” channels foreign exchange toward debt service rather than growth-supporting imports like machinery and technology. High domestic interest rates—still around 12% despite recent cuts—reflect both inflation memory and sovereign risk premiums that make private sector borrowing expensive even as the central bank eases policy.
Export competitiveness erosion presents a third binding constraint. Pakistan’s merchandise exports have stagnated near $30 billion for the past decade while Bangladesh’s doubled to $50+ billion and Vietnam’s surged to $350+ billion. Multiple factors explain this: real exchange rate appreciation during boom periods, energy costs that exceed regional competitors, logistics inefficiencies (it takes 21 days to export a container from Karachi versus 8 from Chittagong or 6 from Ho Chi Minh City), and failure to diversify beyond textiles. Pakistan’s share of global apparel exports has declined from 2.1% in 2010 to 1.6% in 2024 despite lower labor costs than China or India.
Climate vulnerability adds to headwinds. Pakistan contributes less than 1% of global emissions but ranks in the top ten most climate-vulnerable nations. The 2022 floods displaced 33 million people and caused $30 billion in damages—roughly 10% of GDP—demonstrating catastrophic downside risks that growth projections often inadequately incorporate. Irregular monsoons, glacial melt unpredictability affecting Indus water flows, and rising heat extremes threaten both agriculture (21% of GDP, 37% of employment) and urban productivity.
Political economy factors cannot be ignored. Pakistan’s reform record reveals a pattern: crises force IMF programs and initial policy adjustments, but as pressure eases, reforms stall or reverse. Energy tariff adjustments get delayed, tax broadening faces pushback from powerful lobbies, and state-owned enterprise losses accumulate. This stop-go pattern prevents the sustained policy credibility needed to attract long-term investment and integrate into global value chains. Recent political polarization—with former Prime Minister Imran Khan’s party excluded from parliament despite popular support—raises governance risks that investors price into their decisions.
Policy Implications and Pathways to Higher Growth
Moving Pakistan’s growth trajectory from the IMF’s 3–4% range toward the 6–7% the country needs requires addressing root causes, not just symptoms. Five policy domains merit prioritization:
Fiscal sustainability beyond austerity. Pakistan needs tax reform that broadens the base (currently only 2.5 million of 240 million citizens file income tax returns) while simplifying compliance. This requires political will to tax agriculture and retail sectors that currently enjoy exemptions. Equally important: phasing out untargeted energy and commodity subsidies that cost 2–3% of GDP annually while benefiting middle and upper classes disproportionately. Redirecting these resources toward targeted social safety nets and growth-supporting infrastructure would improve both equity and efficiency.
Energy sector transformation. Breaking the circular debt cycle demands difficult choices: adjusting tariffs to cost-recovery levels through gradual, pre-announced schedules that allow households and businesses to adapt; renegotiating or retiring expensive capacity payment contracts; investing in distribution infrastructure to reduce losses; and accelerating renewable energy deployment to lower generation costs long-term. The Renewable Energy Policy framework exists but implementation lags due to financing gaps and bureaucratic obstacles. Pakistan’s solar and wind potential could power rapid industrial growth if unlocked.
Export competitiveness revival. This requires moving beyond generic calls for “export-led growth” toward specific interventions: special economic zones with reliable energy and streamlined customs (learning from Bangladesh’s export processing zones or Vietnam’s industrial parks); trade facilitation reforms that cut documentation time and costs; support for moving up value chains in textiles (from yarn to finished garments to design) and diversifying into sectors like light engineering, pharmaceuticals, and IT services where Pakistan has latent comparative advantages.
Human capital and technology adoption. Pakistan’s adult literacy rate near 60% and tertiary enrollment below 15% constrain productivity growth. Investing in education—particularly girls’ secondary education in rural areas—generates high returns but requires sustained funding and teacher quality improvements. Similarly, digital infrastructure gaps (4G coverage reaches only 60% of territory; broadband penetration lags regional peers) limit tech sector growth and agricultural productivity gains from precision farming. Public-private partnerships modeled on India’s digital India initiative or Rwanda’s smart agriculture programs could accelerate progress.
Private investment climate. Pakistan ranks 108th of 190 countries in the World Bank’s Doing Business indicators, reflecting regulatory complexity, contract enforcement delays, and policy unpredictability. Improving this requires not just regulatory simplification but sustained political stability that assures investors reforms won’t reverse. The government’s recent “Special Investment Facilitation Council” mechanism—fast-tracking approvals for strategic projects—shows potential if maintained beyond current political cycles.
These reforms interact synergistically. Fiscal consolidation creates space for infrastructure investment; energy reliability enables export competitiveness; education improvements enhance technology absorption. But sequencing matters: front-loading politically difficult tax and energy reforms builds credibility for subsequent measures, while early wins in trade facilitation or digital services can demonstrate reform dividends to skeptical publics.
Forward Outlook: Scenarios Through 2030
Pakistan’s growth trajectory over the next five years depends on policy choices and external conditions that remain genuinely uncertain. Three scenarios illustrate the range:
Base Case (40% probability): Muddling Through (3–4% annual growth). Pakistan maintains IMF program compliance, avoiding balance-of-payments crisis but advancing structural reforms slowly. Agriculture grows 2.5–3.5% depending on weather; industry expands 3–4% constrained by energy issues; services sustain 4–5% on remittance support. External financing remains available but expensive; political tensions persist without escalating to crisis. By 2030, GDP per capita reaches $1,800 (from $1,500 in 2025), insufficient to exit lower-middle-income status or absorb labor force growth without rising unemployment. This resembles the past decade’s trajectory—stable but stagnant relative to potential and peers.
Upside Case (30% probability): Reform Breakthrough (5–6% annual growth). A political settlement enables sustained reform implementation. Energy circular debt resolution and renewable deployment improve industrial competitiveness; tax reforms increase revenue-to-GDP from 10% to 14%, funding infrastructure; export competitiveness initiatives attract foreign investment in manufacturing; CPEC revival brings Chinese capital for special economic zones; and climate adaptation investments reduce disaster vulnerability. Services including IT exports (currently $3 billion) triple by 2030. GDP per capita reaches $2,200, approaching Vietnam’s current level. This requires not just good policies but political will and external support that Pakistan has struggled to sustain historically.
Downside Case (30% probability): Crisis and Contraction (1–2% annual growth or periods of negative growth). Political instability escalates, deterring investment; a climate disaster or external shock (Gulf recession cutting remittances; U.S.-China trade war disrupting textile orders) triggers balance-of-payments crisis; IMF program breaks down amid reform resistance; and debt restructuring becomes necessary. Growth collapses to 1–2% as import compression and fiscal austerity bite; unemployment rises, spurring social unrest; and capital flight accelerates. This scenario resembles Sri Lanka’s 2022 crisis but potentially with greater geopolitical complications given Pakistan’s nuclear status and regional tensions.
Importantly, these scenarios aren’t predetermined. Pakistan retains agency through policy choices, even as external constraints bind. The IMF’s 3.2% projection likely reflects roughly 60% base case, 25% downside risk, and 15% upside potential—more pessimistic than optimistic given recent track records.
Regional context matters for these scenarios. If India sustains 6–7% growth and Bangladesh 6%, the competitive pressure on Pakistan intensifies; skilled workers migrate, investors compare returns unfavorably, and the political costs of stagnation rise. Conversely, global slowdown or regional instability might lower the bar for “acceptable” performance but wouldn’t reduce absolute development needs.
Conclusion: Broader Lessons for Emerging Markets
Pakistan’s growth challenge—encapsulated in the IMF’s latest downgrade—illustrates a broader emerging markets dilemma in the 2020s. Macroeconomic stabilization, while necessary, proves insufficient for sustainable growth when structural constraints remain unaddressed. Pakistan has achieved relative price stability (inflation declined from 38% to 8%), currency reserves recover to adequate levels (now covering 3+ months of imports), and fiscal deficits narrow (primary surplus of 0.5% of GDP projected). Yet growth disappoints because energy doesn’t flow reliably, exports don’t compete effectively, and investment doesn’t materialize at scale.
This pattern recurs across developing nations: Egypt maintains IMF programs while struggling to exceed 3–4% growth; Kenya achieves fiscal consolidation but sees limited employment creation; and even reform success stories like Senegal or Côte d’Ivoire hit 5–6% growth but worry about sustainability as commodity windfalls fade. The common thread: stabilization addresses symptoms of crisis but doesn’t automatically build the institutional capacity, infrastructure quality, or human capital depth that compound growth requires.
For Pakistan specifically, the IMF’s 3.2% projection should serve as both warning and motivation. Warning: current trajectories won’t generate the prosperity growth or employment absorption Pakistan’s young population needs; social contract strain will intensify if per capita income stagnates while inequality widens. Motivation: the gap between 3% and 6% growth isn’t unbridgeable—regional peers demonstrate feasibility—but closing it demands policy ambition and political courage that have proven elusive.
Back in Karachi’s Saddar district, Asif Mahmood the textile merchant will make his production decisions based not on government targets or IMF projections, but on whether electricity runs 16 hours or 8, whether yarn costs stabilize or spike, and whether orders arrive from European buyers seeking reliable suppliers. Aggregate these individual decisions across millions of firms and households, and they become the reality that forecasts attempt to capture. Pakistan’s growth outlook will brighten when the structural foundations—energy, exports, education, institutions—make optimism rational rather than aspirational. Until then, even the IMF’s cautious 3.2% carries downside risks that stabilization alone cannot eliminate.
The question facing Pakistan’s policymakers isn’t whether 3.2% growth is acceptable—it clearly isn’t for a nation of 240 million with median age 23. The question is whether the political economy can finally align around the sustained, often painful reforms that higher trajectories require. On that, even the most sophisticated econometric models remain honestly uncertain.


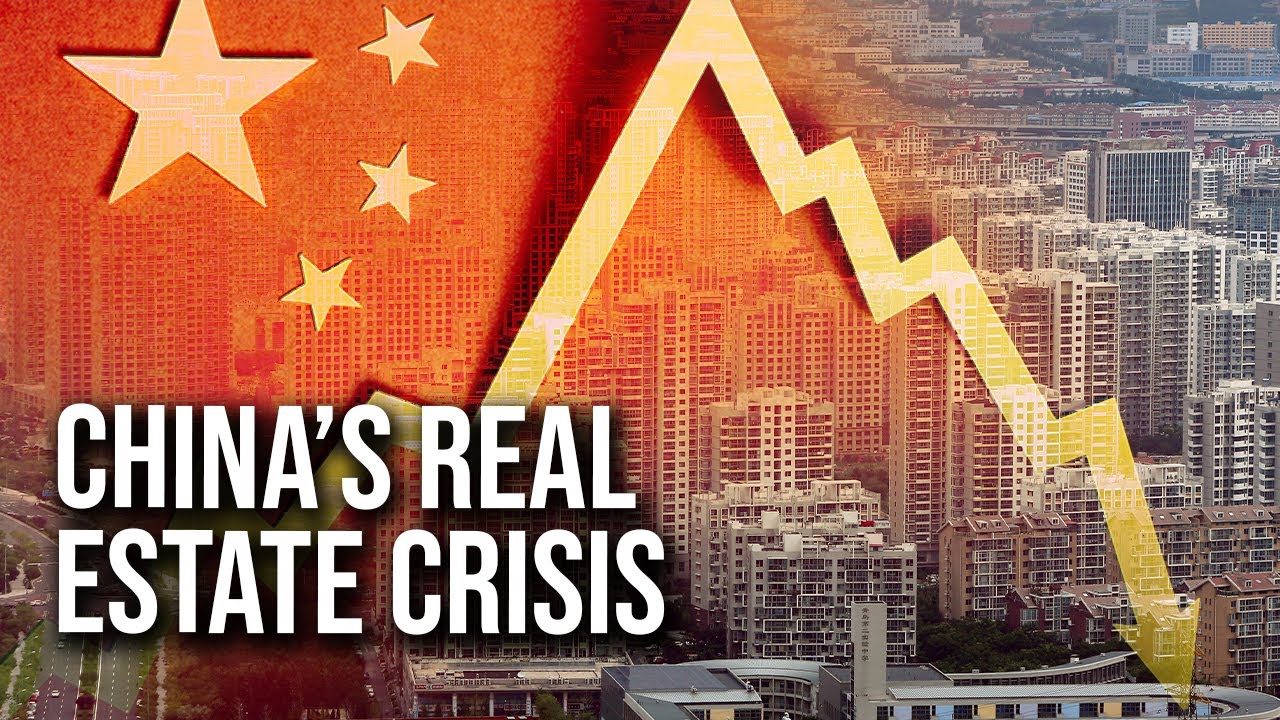
China’s economy in 2026 is a study in contradiction. In its largest cities — Shanghai, Beijing, Guangzhou, Shenzhen — new-home prices have risen for three consecutive months, driven by targeted policy support that is beginning to show traction. Across the remaining hundreds of cities, prices are still falling at a pace that is accelerating, not slowing.
National property investment fell 16.2% year-over-year in the first five months of 2026 — a staggering contraction in a sector that once accounted for roughly a quarter of Chinese GDP. At the same time, China’s technology sector is attracting record capital flows, its export machine is running at full throttle despite global trade tensions, and the People’s Bank of China (PBOC) is quietly implementing some of the most significant monetary architecture reforms in a generation.
China is, in effect, running two economies simultaneously. Understanding which one dominates the other will determine the trajectory of global markets for the next several years.
The Property Sector: A Structural Wound, Not a Cyclical Dip
China’s real estate crisis is entering its fifth year. What began with the 2021 Evergrande collapse has evolved into a sustained structural contraction that is fundamentally reshaping the economic role of property in China’s growth model.
National home prices declined at a faster pace in May 2026 than in April, a sign that market conditions are deteriorating rather than stabilising at the aggregate level. The OECD inventory of unsold homes across China’s lower-tier cities remains enormous — a structural supply overhang that cannot be resolved by demand-side stimulus alone.
The policy response has been asymmetric by design. The central government’s support measures are concentrated in Tier 1 and select Tier 2 cities, where local governments have more fiscal capacity to implement purchase subsidies, down-payment reductions, and mortgage rate cuts. In these markets, the policy appears to be working: new-home prices in China’s first-tier cities rose for the third consecutive month in May.
But first-tier cities account for a small fraction of China’s total housing stock. The vast majority of property — and the vast majority of household wealth — is concentrated in smaller cities where policy support is less effective and price declines are continuing.
The macro consequence is a negative wealth effect that is suppressing consumer confidence and retail spending precisely at the moment China needs domestic demand to compensate for a structurally lower export environment.
The PBOC’s Quiet Revolution
While the property sector weighs on growth, the People’s Bank of China has been implementing a series of significant monetary policy reforms. PBOC Governor Pan Gongsheng announced measures in June 2026 that include:
- Increased use of overnight reverse repo operations, a technical adjustment that improves the PBOC’s ability to manage short-term liquidity conditions with precision
- Narrowing the short-term interest rate corridor, reducing volatility in interbank lending rates and improving monetary policy transmission
- Steps to support the offshore use of the renminbi, accelerating the internationalisation of the Chinese currency as part of China’s longer-term strategy to reduce dependency on the US dollar in global trade and finance
These announcements are significant, but should not be misread as a broad-based monetary stimulus package. The PBOC is reforming its operational framework and improving financial market infrastructure — not firing an economic bazooka. The distinction matters for investors who might expect a China stimulus surge analogous to 2009 or 2015.
For investors, the PBOC’s focus on financial market development and liquidity management signals that policymakers are prioritising long-term stability over short-term growth stimulus. This implies a more gradual recovery trajectory than markets have sometimes assumed.
China’s Export Machine: A Source of Strength and Tension
Against the backdrop of the property slump, China’s export sector is performing exceptionally well. China’s trade surplus has expanded significantly in 2026, driven by:
- Industrial overcapacity in sectors including steel, solar panels, electric vehicles, chemicals, and lithium-ion batteries
- A weaker renminbi that has improved price competitiveness for Chinese exporters in global markets
- Continued strong demand for Chinese manufactured goods from Southeast Asia, Latin America, and Africa — markets that have deepened trade ties with China as US-China trade friction has redirected some Western procurement
China’s strong export growth has sparked significant international pushback. Policymakers across the European Union, the United States, and major emerging markets have expressed concerns about industrial overcapacity and the impact of low-cost Chinese exports on domestic manufacturing industries. The EU has implemented additional tariffs on Chinese electric vehicles, and US tariffs on a broad range of Chinese goods remain elevated following the Trump administration’s tariff regime.
The structural tension: China needs export growth to compensate for weak domestic demand, but its export success is generating the geopolitical friction that could ultimately constrain market access.
China’s AI Pivot: From Property Developer to Tech Powerhouse
The most significant transformation in China’s economic structure in 2026 is not occurring in housing — it is occurring in technology. China’s leadership has made a deliberate and well-resourced pivot toward artificial intelligence, semiconductors, and advanced manufacturing as the new engines of economic growth.
Chinese technology companies including Huawei, Baidu, Alibaba, and ByteDance are investing at scale in AI model development, AI chip design, and AI-integrated enterprise applications. The Chinese government’s industrial policy support for these sectors — through subsidies, preferential financing, and regulatory facilitation — is mobilising capital at a pace that rivals the hyperscaler buildout in the United States.
The strategic motivation is clear: reduce dependency on US semiconductor technology (particularly following US export controls on advanced chips), build sovereign AI capability across defence, governance, and commercial applications, and position Chinese technology companies as global AI leaders in markets outside the Western sphere.
This pivot is creating investment opportunities in Chinese technology equities — though geopolitical risk, regulatory uncertainty, and the US export control regime create complex risk factors that must be weighed carefully by international investors.
The Global Market Implications
China’s two-speed economy creates distinct implications for different asset classes and geographic markets:
Commodities: The property sector contraction is the dominant factor for commodity demand. Steel, copper, cement, and glass — all deeply tied to construction activity — face sustained headwinds from Chinese property weakness. Iron ore prices reflect this dynamic. In contrast, Chinese demand for technology-related commodities (lithium, cobalt, rare earths) remains robust as the EV and battery supply chain continues to scale.
Asian equities: The MSCI Emerging Markets index has significant China weighting, and China’s two-speed dynamics are creating divergence between technology-oriented Chinese equities (performing well) and property/financial sector stocks (underperforming). Country selection and sector allocation matter enormously in the current Chinese equity environment.
Currency markets: The PBOC’s renminbi internationalisation measures represent a long-duration effort to reduce dollar dependence. In the near term, currency management remains a key PBOC tool — managed depreciation to support exporters, with intervention to prevent disorderly moves that could trigger capital outflows.
European and US corporates: Companies with significant China exposure face a bifurcated operating environment — strong demand in technology-related end markets, weak demand in consumer and construction-related segments. Luxury goods, industrials, and materials companies are disproportionately affected by the property sector contraction.
The Policy Outlook: What Comes Next
The Chinese government faces a genuinely difficult policy dilemma. Aggressive fiscal or monetary stimulus risks reigniting the debt dynamics that made the property crisis inevitable in the first place. Insufficient support risks a deeper consumer confidence collapse that could turn a structural slowdown into a sharper cyclical downturn.
The current policy approach — targeted support for Tier 1 property markets, incremental PBOC reforms, and aggressive industrial policy investment in technology sectors — represents a careful balancing act. It is not the big bang stimulus that some investors have anticipated, but it is also not the hands-off approach that would allow a disorderly collapse.
The most likely trajectory: China grows at 4.0%–4.5% in 2026, below its historical average but ahead of the IMF’s revised global growth forecast of 3.1%. The property sector continues to weigh on domestic demand, while exports and technology investment provide partial offsets. The renminbi remains managed, and the PBOC avoids large-scale interest rate cuts that would widen the US-China rate differential and accelerate capital outflows.
The Bottom Line
China’s economy in 2026 is not in crisis, but it is in transition — and the transition is proving slower and more painful than the optimists predicted. The property sector wound is structural, not cyclical. The technology pivot is real but will take years to fully offset the economic weight that property once carried.
For global investors, China remains the world’s second-largest economy and a critical driver of commodity, trade, and technology markets. Ignoring it is not an option. But the analytical frameworks from the 2010s — property-led, infrastructure-driven, credit-fuelled growth — are no longer the right lens through which to assess Chinese economic dynamics in 2026.
The new China story is being written in data centres, EV factories, and AI labs — not in unfinished apartment towers.
FAQs
Q: What is happening with China’s economy in 2026?
A: China is running a two-speed economy. The property sector is contracting sharply — investment fell 16.2% year-over-year in early 2026 — while technology investment, AI spending, and exports are growing. The PBOC is implementing monetary reforms without large-scale stimulus.
Q: Is China’s property market recovering in 2026?
A: Partially and unevenly. New home prices in Tier 1 cities rose for three consecutive months through May 2026, suggesting policy support is gaining traction in the largest markets. Nationally, however, prices declined at a faster pace in May than April, and the recovery remains uneven across regions.
Q: What is China’s GDP growth forecast for 2026?
A: Most forecasters project China’s GDP growth at approximately 4.0%–4.5% in 2026 — below historical averages but above the IMF’s global average of 3.1%. The property sector contraction is the primary drag, partially offset by technology investment and export growth.
Q: How is China’s AI investment affecting global markets?
A: China’s AI and technology pivot is creating strong demand for technology-related commodities (lithium, rare earths), boosting Chinese technology equities, and intensifying competition with US and European AI companies — particularly in markets outside the Western sphere.
Analysis
Nidec Accounting Fraud: The Pressure Culture That Built Japan’s Biggest Corporate Scandal in a Decade

There’s a comic book on Nidec’s website — or there was, until recently — called “The Man Hotter Than the Sun.“ It chronicles the rise of Shigenobu Nagamori, who founded the world’s largest precision motor company in a shack in Kyoto in 1973 and built it into a global industrial giant supplying Apple, the automotive sector, and half the data centres on earth. Hard work. Relentless ambition. Numbers that never disappointed. It was a very Japanese success story, and it was also, investigators have now concluded, partly a fiction — one sustained for years by managers who inflated profits rather than face the man whose sun, apparently, could not be allowed to set.
What Is the Nidec Accounting Fraud — and How Big Is It?
The Nidec accounting fraud is Japan’s largest corporate accounting scandal in at least a decade. A third-party committee report released in March 2026 found that Nidec Corporation had committed accounting fraud totalling 166.2 billion yen — roughly $1.1 billion — as of 2023. That figure, staggering on its own, is likely the floor. The company has warned it may be forced to book an additional ¥250 billion, or $1.6 billion, in impairment charges as the full cost of the scandal is tallied, with third-party investigators saying they uncovered at least 1,000 separate instances of improper accounting across the group. Seoul Economic DailyBloomberg
The scandal first showed its face not in Kyoto, where Nidec is headquartered, but in Casalmaggiore, a small town in northern Italy’s Po Valley. It was the company’s Italian subsidiary, Nidec FIR International S.R.L., where possible lapses first surfaced in June 2025, forcing Nidec to delay filing its annual financial results. Within months, a Chinese subsidiary was implicated too, and then the scope widened further: investigators found misconduct at operations in Switzerland and across Nidec’s automotive inverter business. financialcontent
On October 28, 2025, the Tokyo Stock Exchange designated Nidec’s stock as a “security on special alert,” citing substantial need for improving the company’s internal management systems. The move sent shares tumbling by their daily 500 yen limit — a drop of roughly 19% in a single session. By the time the formal third-party report landed on February 27, 2026, Chairman Hiroshi Kobe and three other senior executives had resigned. Moody’s downgraded Nidec’s debt rating three levels into junk territory, and the stock was removed from the Nikkei 225 index. CEO Mitsuya Kishida bowed publicly at a press conference and said he would forfeit his salary until October. NIDEC CORPORATIONMy-cpe
The mechanics of the fraud were, in retrospect, classically mundane. Misconduct confirmed at Nidec Group bases included: avoidance of recognising valuation losses on obsolete raw materials and finished goods; improper avoidance of impairment losses based on sales plans with low probability of achievement; inflated inventory values; misreported customs declarations; government grants booked as revenue. Each individual manipulation was modest. Aggregated across dozens of subsidiaries over multiple years, they added up to a billion-dollar lie. NIDEC CORPORATION
How Did Corporate Culture Drive the Fraud?
This is where the story moves from accounting irregularity to structural pathology. The central finding of the independent investigation is not that Nagamori ordered the fraud — investigators found no evidence he personally directed specific manipulations. What they found was more insidious.
The committee blamed founder Shigenobu Nagamori for “excessive pressure to meet performance targets,” particularly profit targets, and found that many business units attempted to meet their goals using creative accounting. In plain terms: managers across Italy, China, and Switzerland were not cooking the books because they were corrupt. They were doing it because the alternative — telling Nagamori, a man who has written books about his rags-to-riches philosophy and whose image once adorned the company’s public website — that the numbers wouldn’t hit, was something the culture simply didn’t allow. MarketScreener
What caused the Nidec accounting fraud? The third-party investigation concluded that Nagamori’s excessive pressure on staff to meet profit targets created a corporate culture in which managers across multiple countries resorted to improper accounting rather than miss their numbers. Investigators documented more than 1,000 separate instances of misconduct spread across the group’s global subsidiaries.
This mechanism — what organisational theorists sometimes call “performance pressure fraud” — is not unique to Japan. But it finds particularly fertile ground in founder-dominated companies, where the founder’s authority has rarely been formally checked and where decades of success have calcified the idea that the numbers are always achievable if you push hard enough. Nagamori had, famously, sent regular messages to senior managers demanding better performance. As far back as September 2021, after handing over the CEO role, he was telling managers that the company faced its biggest-ever business crisis and that they needed to do more to boost performance and the share price. The message, delivered repeatedly across years, wasn’t lost on the people below him. Bloomberg
Oasis Management, the activist fund that holds approximately 6.7% of Nidec, described the problem bluntly in March 2026: “The problem at Nidec lies in a corporate culture that pressured employees into engaging in improper accounting practices for the sake of performance or share price; a lack of ethical judgment among management that effectively tolerated such improper accounting; the failure to establish appropriate checks and balances.” businesswire
What Are the Implications for Nidec and Japan Inc.?
The immediate picture for Nidec itself is grim. CEO Kishida has announced a plan to spend ¥130 billion over five years on measures to prevent recurrence and rebuild the governance system, including the suspension of the company’s once-aggressive acquisition strategy. Business acquisitions had been Nidec’s primary growth engine for three decades — an irony not lost on investors, since it was precisely that acquisition-driven expansion into Italy, China, and Switzerland that created the dispersed, difficult-to-audit subsidiaries where the fraud took root. The Japan Times
Nidec has also cancelled its year-end dividend for the fiscal year ending March 2026, with the company saying it “has no choice” given the investigation’s material impact on its financial closing for past fiscal years. The Securities and Exchange Surveillance Commission has reportedly begun its own probe, adding a regulatory dimension to what is already a reputational and financial catastrophe. NIDEC CORPORATION
The broader signal for Japanese markets is harder to read, but not easily dismissed. Japan’s corporate governance reform drive — accelerated by the Tokyo Stock Exchange’s 2023 push to force companies trading below book value to justify their capital allocation — was already testing the limits of how far founder-controlled companies would actually change. Nidec was, until recently, considered a model of what Japanese manufacturing could become: globally scaled, technically sophisticated, financially driven. The revelation that its financial sophistication was partly illusory lands badly at precisely the moment foreign investors have been warming to Japan’s equity story.
Academic research published in the Asia Pacific Journal of Management in 2025 found that the combination of foreign investor pressure for short-term gains and inadequately independent boards — particularly at companies with concentrated founder ownership — significantly elevates the risk of corporate misconduct in Japanese firms. Nidec fits the profile precisely. Springer
The Counterargument: Was Nagamori Singled Out Unfairly?
Not everyone is persuaded that Nagamori is the villain this narrative requires. Some analysts argue that to pin a systemic governance failure on one individual’s personality is to let the board, the auditors, and the company’s own internal compliance function off the hook entirely.
PwC, Nidec’s auditor, issued a disclaimer of opinion on the company’s fiscal year 2025 consolidated financial statements — an extraordinary step that signals the auditor could not obtain sufficient evidence to form a view. PwC pointed specifically to accounting practices that could have a “significant impact on consolidated financial statements” due to arbitrary adjustments in the timing of asset write-downs. That’s a significant failure of external oversight, and it raises questions about why red flags were not raised earlier in an audit relationship that spans years. mexc
There’s also a legitimate argument that the third-party committee report, while technically independent, was commissioned by Nidec itself — a structural limitation that critics of Japan’s third-party committee system have long flagged. The Japan Federation of Bar Associations guidelines that govern these panels were designed for transparency, but the panels’ independence is fundamentally constrained by the fact that the company in question controls the scope and, ultimately, bears the costs of the investigation. Whether the 1,000-plus instances of misconduct represent the full picture, or merely the portion the investigation was equipped to find, remains an open question.
Still, that caveat doesn’t fundamentally alter the central finding. A culture doesn’t become fraudulent by accident. Someone has to set the temperature.
A Reckoning That Was Always Coming
Nidec’s Culture Transformation Lab — the body launched on February 1, 2026, to “convey the voices of front-line employees directly to management” — has a name that reads less like a corporate initiative and more like an admission. If front-line voices needed a formal laboratory to be heard, the silence before it was built tells you everything about what the organisation had become.
The Nidec accounting fraud is, at one level, a story about a single company and a single founder’s shadow falling too far across the boardroom. At another level, it’s a test case for whether Japan’s governance reforms have teeth. The TSE’s special alert mechanism worked; Moody’s downgrade worked; the independent investigation worked. What didn’t work, for years, was the ordinary internal machinery that is supposed to catch this kind of thing before it reaches $1.1 billion.
That machinery failed because the people operating it were too afraid to make it fail in the other direction.
The comic book about the man hotter than the sun has been quietly removed from Nidec’s website. What’s left is a company trying to figure out how to build something that doesn’t burn everything around it.

Mining stocks across Europe came under renewed pressure in the latest trading session, extending a soft patch that has quietly gathered momentum over recent weeks. The tone was not disorderly, but it was decisively negative, with cyclical exposure once again proving sensitive to shifting commodity expectations.
In Dublin, Kenmare Resources stood out on the downside, weighing on the Iseq index after fresh concerns around titanium mineral pricing and operational strain linked to its Mozambique operations. The move reinforced a broader pattern: when sentiment turns against industrial metals, smaller producers tend to absorb the sharpest adjustment.
By mid-session, traders described the market as “directionless but heavy,” with few buyers willing to step in ahead of clearer signals on demand and pricing stability.
The latest weakness in mining equities is unfolding against a backdrop of uneven global growth signals and persistent uncertainty in industrial demand. Markets have been oscillating between brief optimism on infrastructure-led demand and deeper concerns about China’s property sector, which continues to shape global metals consumption.
Currency dynamics are adding another layer of pressure. A firmer US dollar typically weighs on commodities priced in dollars, tightening financial conditions for non-US buyers and feeding through into equity valuations of mining firms.
Research desks across major banks have repeatedly flagged the sensitivity of mining stocks to macro shocks, particularly interest rate expectations and industrial production cycles. Even modest revisions to growth forecasts tend to produce outsized moves in the sector, reflecting its position at the more volatile end of the equity spectrum.
Recent broker commentary has also pointed to renewed caution in European materials equities, citing slower-than-expected demand recovery and elevated input cost structures that continue to compress margins.
1 — European mining stocks under pressure
European mining stocks extend losses on demand concerns
European mining stocks slipped broadly as investors reassessed near-term earnings potential across the sector. The weakness was not confined to a single commodity group, but rather reflected a coordinated pullback in sentiment toward industrial metals and related equities.
Data from European equity markets shows that mining remains among the most cyclical segments of the index universe, often leading both rallies and corrections depending on global demand expectations. Recent trading sessions have reinforced that pattern, with miners underperforming broader industrials as risk appetite faded.
A key driver has been softening expectations around base metals demand, particularly copper and iron ore, where forward pricing has become more sensitive to revisions in Chinese industrial activity forecasts. Even incremental downgrades to growth assumptions have been enough to trigger equity repricing.
Kenmare Resources added a sharper, stock-specific dimension to the broader move. The company, which operates the Moma titanium minerals mine in Mozambique, has faced sustained pressure from weaker ilmenite and zircon pricing, alongside operational and cost-side constraints.
Recent financial disclosures highlighted the strain clearly, with the company reporting a significant deterioration in profitability and moving to conserve cash amid weaker market conditions. Dividend payments were suspended following impairment charges and lower earnings visibility, underscoring the sensitivity of mid-cap miners to commodity cycles.
The reaction in Dublin was swift. As one of the more index-sensitive constituents, Kenmare’s decline had an outsized impact on the Iseq, amplifying the broader negative tone in Irish equities.
The episode also highlights a structural feature of mining indices: concentration risk. When a handful of commodity-linked names dominate index weighting, company-specific stress can quickly translate into index-level moves.
2 — Why mining equities are underperforming
Secondary keyword: Kenmare Resources shares and valuation reset
The pressure on Kenmare Resources shares reflects a wider repricing underway across mid-cap mining equities, where earnings visibility is tightly linked to spot commodity markets and cost discipline.
At the core of the current weakness is a simple mechanism: falling commodity price expectations reduce forward earnings, while higher discount rates compress valuation multiples at the same time. That dual squeeze tends to hit mining equities harder than most other sectors.
A frequently asked question among investors is:
Why are European mining stocks falling?
European mining stocks are falling due to weaker industrial metal price expectations, persistent uncertainty around global demand growth, and a stronger US dollar that reduces commodity pricing support. At the same time, company-specific issues such as rising costs and operational disruptions are intensifying pressure on individual miners, particularly mid-cap producers with concentrated asset exposure.
The timing effect is also important. Commodity markets often stabilise before equities do, because investors wait for confirmation of sustained demand recovery rather than reacting to short-term price moves. This creates a lag where mining equities continue to decline even as some underlying commodities begin to level out.
There is also an ongoing valuation reset. Following the post-pandemic commodity surge, mining equities traded at elevated earnings multiples relative to historical norms. As those expectations normalise, the adjustment process tends to overshoot before stabilising.
In that sense, current price action reflects repricing discipline rather than disorderly selling.
3 — Broader implications for markets and industry
The implications of weaker mining equities extend beyond short-term portfolio performance. In capital-intensive industries like mining, equity valuations play a direct role in shaping investment decisions, project timelines, and dividend policy.
For producers of titanium minerals such as Kenmare, pricing weakness in ilmenite and zircon feeds directly into revenue streams that are already exposed to cyclical industrial demand. When construction and manufacturing activity slows globally, downstream demand for pigments, coatings, and ceramics tends to soften with a lag.
Recent company commentary has pointed to efforts to manage costs and preserve liquidity, reflecting a more defensive operational stance in response to uncertain pricing conditions. That shift is typical of mid-cycle corrections, where producers prioritise balance sheet strength over expansion.
At a macro level, mining equities often serve as an early indicator of industrial demand trends. Prolonged weakness in the sector can signal broader slowdowns in manufacturing activity, particularly in export-oriented European economies.
Currency dynamics add another feedback loop. If commodity prices remain under pressure, they can reinforce US dollar strength, which in turn weighs further on commodity-linked equities. This interaction has historically amplified downturns in the mining cycle.
The key risk from here is duration. Short corrections tend to be absorbed quickly, but extended periods of weak pricing often trigger deeper adjustments in capital allocation across the sector, including delayed investment and tighter shareholder distributions.
4 — Alternative views and counterbalance
Not all market participants interpret the current weakness as the start of a sustained downturn.
Some equity strategists argue that valuations across European mining stocks already reflect a significant portion of near-term downside risk. They point to earlier corrections in materials equities and suggest that balance sheets among major diversified miners remain relatively resilient.
There is also a longer-term structural argument anchored in energy transition demand. Copper, nickel, titanium minerals, and related inputs are expected to play a central role in electrification, infrastructure renewal, and aerospace applications. From this perspective, short-term demand softness may obscure a more durable upward trajectory in structural demand.
Kenmare itself has highlighted signs of stabilisation in certain product lines, particularly zircon, where pricing has shown less volatility than broader industrial metals. That divergence suggests that not all segments of the mining complex are moving in sync.
Still, the counterargument depends heavily on timing. Even structurally positive demand narratives do not prevent near-term equity repricing when earnings weaken. Markets tend to discount recovery, but only once tangible data confirms it.
CLOSING
The latest decline in European mining stocks is less a break in trend than a continuation of a familiar cycle. Commodity expectations soften, earnings forecasts adjust, and equities respond ahead of the macro data that eventually confirms or challenges those expectations.
Kenmare’s performance simply sharpened that adjustment, exposing how quickly sentiment can shift in concentrated, commodity-linked indices like the Iseq.
What matters now is not the direction of a single session, but whether industrial demand stabilises long enough to anchor earnings expectations once again.
Until that happens, mining equities are likely to remain tethered to sentiment as much as fundamentals.

Pakistan’s Remittance Lifeline: Why Gulf Exposure Is a Hidden Risk

Dubai’s Rise to the World’s 7th Financial Hub: Inside the D33 Push

China EV Exports Hit Record High in 2026

UK’s “National Contributions Tax” Explained: Burnham-Era Reform 2026

Russia’s Strange Problem in 2026: Its Currency Is Too Strong

Section 301 Forced Labor Tariffs 2026: 60 Countries Affected

UK National Contributions Tax: Burnham’s Radical Tax Plan

Global Central Bank Divergence 2026: Why the Fed, BoE, BoJ, and PBoC Are All Moving Differently

Japan’s Bond Market Just Cracked. It Could Take the Rest of the World’s Debt With It

Malaysia’s Ringgit Is Holding Up. Economists Say the Real Test Is Still Coming

Climate Finance Delivery 2026: Trillion‑Dollar Promise Still Unmet

AI Impact on Wages 2026: Productivity Soars, Paychecks Stagnate

SpaceX IPO 2026: $2 Trillion AI Bubble, OpenAI & Anthropic — What Investors Must Know

China Economy 2026: Property Crisis, AI Investment & Export Surplus Explained

Top 15 Stocks for Investment in 2026 in PSX: Your Complete Guide to Pakistan’s Best Investment Opportunities
Top 15 Stocks for Investment in 2026 in PSX: Your Complete Guide to Pakistan’s Best Investment Opportunities

Debunking IMF Program Myths: Reconfiguring Engagement for True National Ownership in a Volatile World

Top 10 Mutual Fund Managers in Pakistan for Investment in 2026: A Comprehensive Guide for Optimal Returns

What the U.S. Attack on Venezuela Could Mean for Oil and Canadian Crude Exports: The Economic Impact

China’s 50% Domestic Equipment Rule: The Semiconductor Mandate Reshaping Global Tech

15 Most Lucrative Sectors for Investment in Pakistan: A 2025 Data-Driven Analysis

Pakistan’s Export Goldmine: 10 Game-Changing Markets Where Pakistani Businesses Are Winning Big in 2025
15 Most Lucrative Sectors for Investment in Pakistan: A 2025 Data-Driven Analysis
15 Most Lucrative Sectors for Investment in Pakistan: A 2025 Data-Driven Analysis

Pakistan’s Economic Outlook 2025: Between Stabilization and the Shadow of Stagnation
Pakistan’s Economic Outlook 2025: Between Stabilization and the Shadow of Stagnation

China’s Property Woes Could Last Until 2030—Despite Beijing’s Best Censorship Efforts
China’s Property Woes Could Last Until 2030—Despite Beijing’s Best Censorship Efforts
-
 Markets & Finance7 months ago
Top 15 Stocks for Investment in 2026 in PSX: Your Complete Guide to Pakistan’s Best Investment Opportunities
-
Markets & Finance7 months ago
Top 15 Stocks for Investment in 2026 in PSX: Your Complete Guide to Pakistan’s Best Investment Opportunities
-
 Analysis6 months ago
Debunking IMF Program Myths: Reconfiguring Engagement for True National Ownership in a Volatile World
-
 Investment6 months ago
Top 10 Mutual Fund Managers in Pakistan for Investment in 2026: A Comprehensive Guide for Optimal Returns
-
 Global Economy7 months ago
What the U.S. Attack on Venezuela Could Mean for Oil and Canadian Crude Exports: The Economic Impact
-
 Asia7 months ago
China’s 50% Domestic Equipment Rule: The Semiconductor Mandate Reshaping Global Tech
-
 AI7 months ago
15 Most Lucrative Sectors for Investment in Pakistan: A 2025 Data-Driven Analysis
-
 Exports7 months ago
Pakistan’s Export Goldmine: 10 Game-Changing Markets Where Pakistani Businesses Are Winning Big in 2025