
Policy
Monetary Policy and the Policy Rate

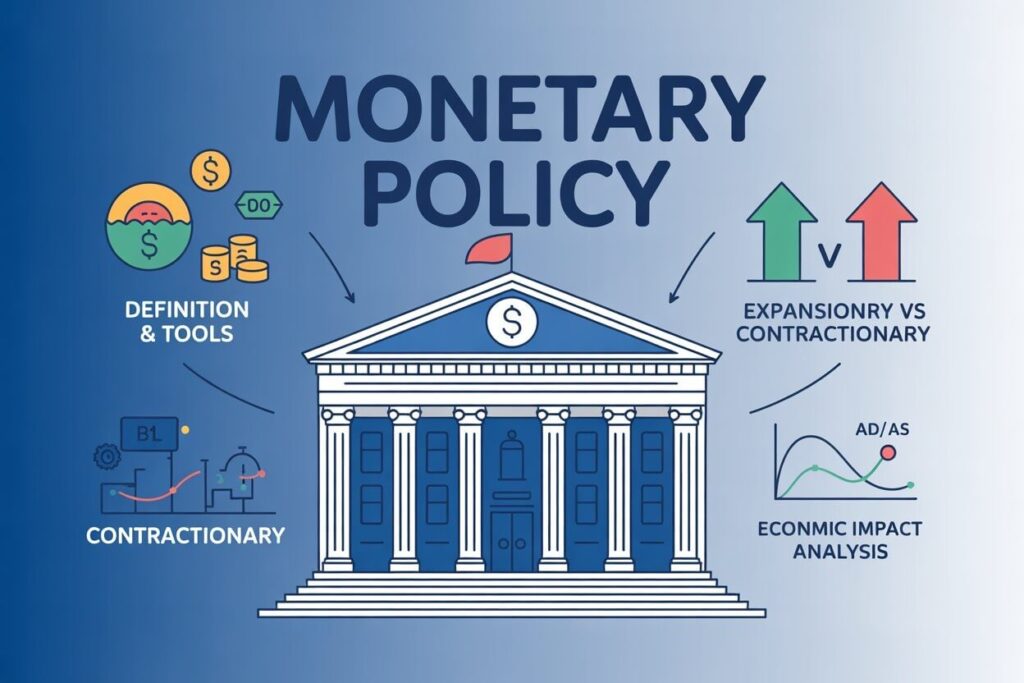
How Central Banks Steer the Economy and Control Inflation
Monetary Policy consists of the macroeconomic strategies, tools, and actions implemented by a country’s central bank to manage the money supply, control inflation, and ensure sustainable economic growth. The primary instrument for executing this policy is the Policy Rate (often referred to as the benchmark interest rate or target rate).
For financial professionals, investors, and the audience of economist.media, the central bank’s monetary policy decisions are the most closely watched economic events of the year. The policy rate acts as the financial gravity of an economy; every other interest rate—from corporate loans to auto financing and savings accounts—is anchored to it.
The Mandate of the Central Bank
Most modern central banks, including the State Bank of Pakistan (SBP) and the US Federal Reserve, operate with a specific legal mandate. Generally, their primary goal is price stability (keeping inflation low and predictable). Secondary mandates often include maximizing employment and maintaining the stability of the financial system.
Central banks use the policy rate to balance the economy on a tightrope. If the economy grows too fast, it risks hyperinflation. If it grows too slowly, it risks recession and mass unemployment.
The Policy Rate Mechanism: Expansionary vs. Contractionary
The central bank’s Monetary Policy Committee (MPC) meets regularly to assess macroeconomic indicators (like CPI, GDP growth, and trade balances) and decides whether to alter the policy rate.
1. Contractionary Monetary Policy (Hawkish Stance): When inflation is running too high, the central bank implements a contractionary policy by increasing the policy rate.
- How it works: By raising the benchmark rate, the central bank makes it more expensive for commercial banks to borrow money. The commercial banks pass these higher costs onto their customers by raising interest rates on corporate loans, mortgages, and credit cards.
- The Result: Borrowing becomes expensive, so businesses delay expansion and consumers cut back on big-ticket purchases. Simultaneously, higher rates on savings accounts encourage people to save rather than spend. This aggregate drop in demand forces businesses to halt price increases, effectively cooling down inflation.
2. Expansionary Monetary Policy (Dovish Stance): When the economy is sluggish, facing a recession, or experiencing high unemployment, the central bank implements an expansionary policy by decreasing the policy rate.
- How it works: Lowering the rate makes borrowing cheap. Commercial banks slash rates on business loans and consumer credit.
- The Result: Businesses take out loans to build new factories and hire workers. Consumers borrow money to buy houses and cars. Because savings accounts offer negligible returns, people are incentivized to spend or invest in the stock market. This surge in economic activity stimulates GDP growth and creates jobs.
Tools of Monetary Policy
While the policy rate is the headline tool, central banks utilize a suite of mechanisms to control the money supply:
- Open Market Operations (OMOs): This is the most frequently used tool. The central bank buys or sells government securities (like Treasury Bills) in the open market. When the central bank buys securities, it injects cash into the banking system, expanding the money supply. When it sells securities, it pulls cash out of the system, tightening the money supply.
- Reserve Requirements (CRR/SLR): The central bank mandates that commercial banks must hold a certain percentage of their total customer deposits in reserve (either as cash in the vault or at the central bank). If the central bank raises the reserve requirement, banks have less money available to lend out, which contracts the money supply.
- Discount Window Lending: The interest rate at which the central bank lends money overnight to commercial banks facing temporary liquidity shortages.
The Transmission Mechanism and Time Lags
A crucial concept in economics is the Monetary Policy Transmission Mechanism—the complex pathway through which a change in the central bank’s policy rate ripples through the financial sector and eventually impacts the real economy (prices and employment).
In Pakistan, when the SBP changes the policy rate, it immediately affects the Karachi Interbank Offered Rate (KIBOR), which is the rate at which banks lend to one another. KIBOR dictates the pricing of corporate loans.
However, monetary policy is notoriously subject to time lags. When a central bank raises interest rates today, the full disinflationary effect on the real economy might not be felt for 12 to 18 months. Businesses do not cancel long-term construction projects overnight, and consumers do not immediately change their spending habits. This delay requires central bankers to be forward-looking, adjusting rates based on where they forecast inflation will be in the future, rather than where it is today.
The Impact on the Exchange Rate
Monetary policy also heavily dictates currency valuation through the principle of interest rate parity. If a country raises its policy rate significantly higher than global averages, it attracts foreign portfolio investors seeking high yields. These investors must buy the local currency to invest in local bonds, which increases demand for the currency and causes it to appreciate. Conversely, cutting rates can lead to capital flight and currency depreciation.
Key Takeaways:
- Monetary policy is managed by the central bank to control inflation and stabilize economic growth.
- The Policy Rate is the benchmark interest rate that dictates borrowing costs across the entire economy.
- To fight inflation, central banks raise rates (contractionary); to fight recessions, they lower rates (expansionary).
- Monetary policy changes take time to filter through the economy, often taking 12 to 18 months to fully impact inflation.
- Higher interest rates generally strengthen a national currency by attracting foreign yield-seeking capital.
Authoritative Sources & Further Reading:


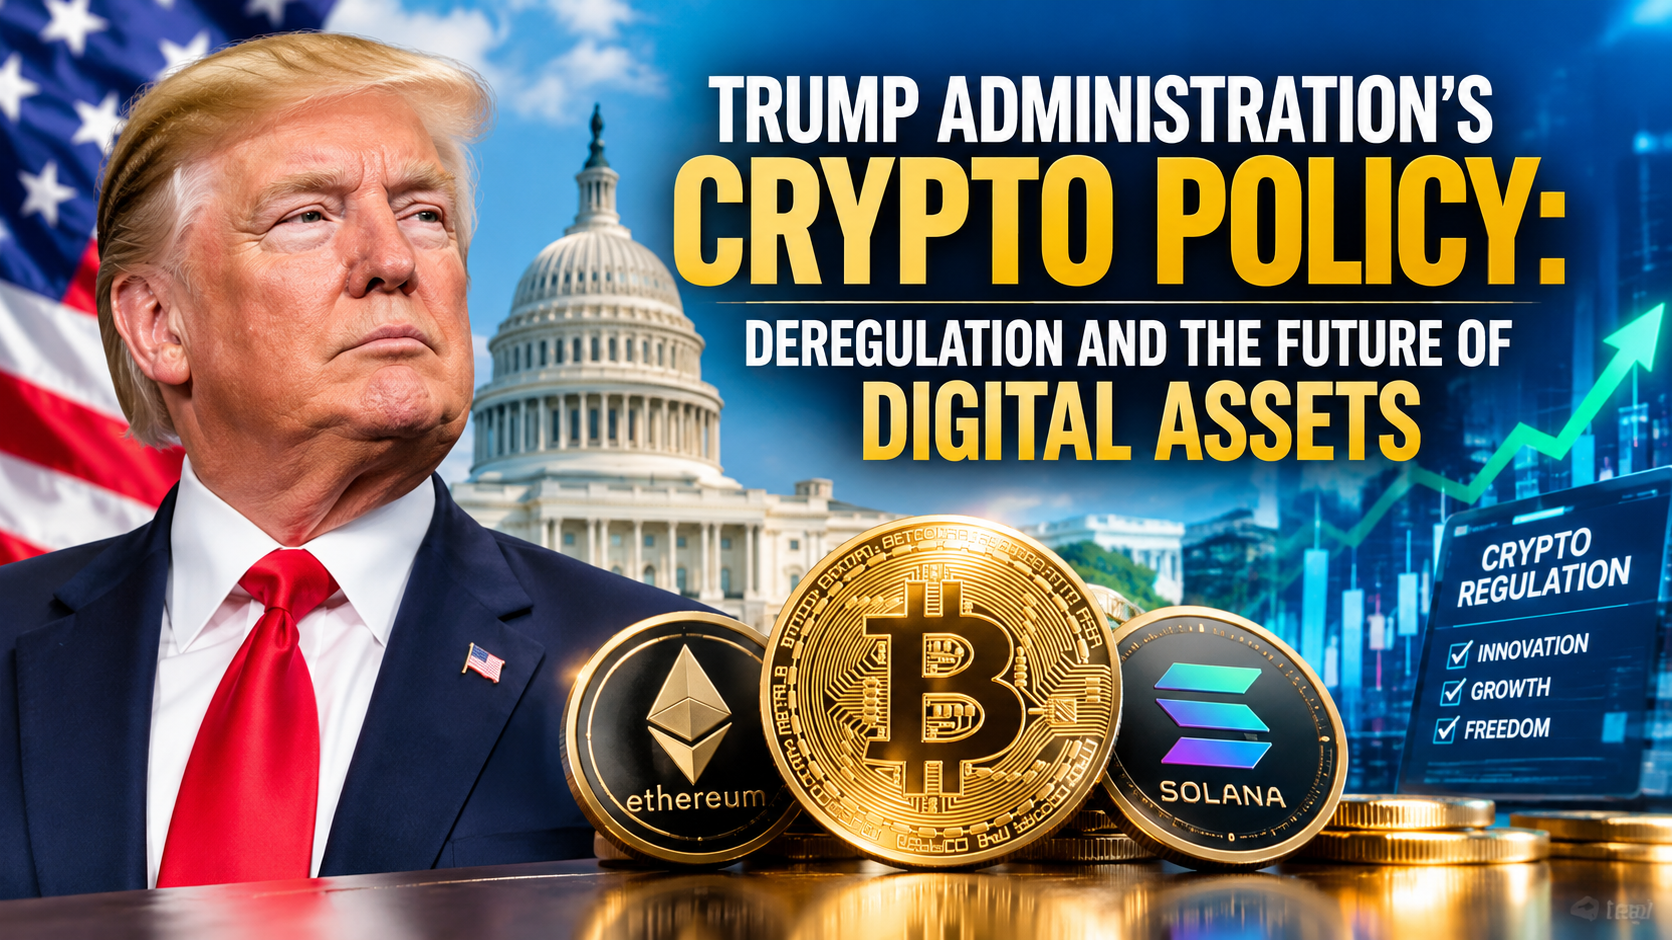
In under two years, the regulatory posture toward crypto in the United States has flipped from adversarial to explicitly promotional. What began as an executive order in January 2025 has cascaded into a stablecoin law, a coordinated SEC-CFTC framework, a five-category classification system for digital assets, and — as of this week — a genuine test of whether Congress can finish the job with comprehensive market-structure legislation. Here is the full architecture of Trump-era crypto policy as it stands in September 2026.
The Foundation: Executive Order 14178 and the White House Report
The administration’s crypto agenda traces back to Executive Order 14178, issued at the start of the second Trump term. On July 30, 2025, the President’s Working Group on Digital Asset Markets — established under that order — issued a comprehensive report titled “Strengthening American Leadership in Digital Financial Technology,” according to Practical Law’s coverage. That report became the blueprint both the SEC and CFTC would spend the next year implementing.
SEC’s “Project Crypto” and CFTC’s “Crypto Sprint”
Within 48 hours of the White House report’s release, both major regulators launched dedicated initiatives. SEC Chair Paul Atkins announced “Project Crypto” on July 31, 2025 — an agency-wide effort to implement the White House’s recommendations, with five stated priorities including, notably, “onshoring crypto to the US,” per Practical Law. Chair Atkins directed the SEC’s policy divisions to coordinate with the agency’s Crypto Task Force, led by Commissioner Hester Peirce, a longtime industry-friendly voice at the Commission.
The very next day, then-Acting CFTC Chair Caroline Pham launched a parallel “Crypto Sprint,” a 12-month initiative covering the listing of spot digital assets on CFTC-registered exchanges, allowing derivatives market participants to use tokenized collateral including stablecoins, and establishing a “CEO Innovation Council” of 12 exchange executives, according to K&L Gates. Within months, the CFTC confirmed spot digital assets were available for trading on a CFTC-registered exchange for the first time.
The GENIUS Act: America’s First Federal Stablecoin Law
The most concrete legislative achievement of the period has been the GENIUS Act, the first U.S. federal law specifically governing stablecoins. Its enactment triggered a wave of follow-on rulemaking: K&L Gates noted that the Treasury Department, the Office of the Comptroller of the Currency, and other federal banking agencies all opened rulemakings to implement the law during 2026. The GENIUS Act’s definition of “digital asset” has since become the template other agencies build from — the SEC’s own proposed crypto-asset offering rules explicitly mirror the GENIUS Act’s definitional language.
March 2026: The SEC-CFTC Coordination Breakthrough
The most significant structural shift arrived in March 2026. On March 11, SEC Chairman Paul Atkins and CFTC Chairman Michael Selig signed a Memorandum of Understanding to formally coordinate the two agencies’ historically overlapping and often conflicting jurisdiction over digital assets, according to Latham & Watkins’ policy tracker. The MOU commits both agencies to a “minimum effective dose” of regulation intended to promote innovation while still protecting market integrity.
Six days later, on March 17, 2026, the SEC and CFTC jointly published an interpretive release — their first major coordinated statement since the MOU — sorting digital assets into a five-category framework, according to Holland & Knight: digital commodities, digital collectibles, digital tools, payment stablecoins (aligned with the GENIUS Act definition), and a fifth category covering more traditional securities-like tokens. That classification system is now the reference point nearly every subsequent rulemaking builds from.
Trump-era crypto policy timeline:
| Date | Development | Body |
|---|---|---|
| Jan 2025 | Executive Order 14178 | White House |
| Jul 30, 2025 | Digital asset policy report | Presidential Working Group |
| Jul 31, 2025 | “Project Crypto” launched | SEC (Chair Atkins) |
| Aug 1, 2025 | “Crypto Sprint” launched | CFTC (Acting Chair Pham) |
| — 2025 | GENIUS Act enacted | Congress |
| Mar 11, 2026 | SEC-CFTC MOU signed | SEC + CFTC |
| Mar 17, 2026 | Five-bucket digital asset classification | SEC + CFTC joint release |
| Aug 2026 | “Regulation Crypto Assets” proposed | SEC |
| Sep 10, 2026 | Revised 630-page CLARITY Act released | Senate Republicans |
| Sep 15, 2026 | Procedural vote scheduled | U.S. Senate |
SEC Proposes “Regulation Crypto Assets”
In August 2026, the SEC moved from interpretation to formal rulemaking, proposing “Regulation Crypto Assets” — a bespoke offering regime specifically for crypto investment contracts. According to Sidley Austin’s analysis, Chairman Atkins said the proposed rules “draw heavily from Congressional work over recent years, particularly the CLARITY Act,” explicitly designing the rule to give the industry a regulatory head start pending final legislation. The proposal’s four-year window for a startup exemption mirrors the CLARITY Act’s own timeline for a token project to reach “mature blockchain system” status — a deliberate signal that the SEC expects the legislative and regulatory tracks to converge.
The Unfinished Business: CLARITY Act’s Uncertain Fate
Despite the extensive regulatory groundwork, the industry’s top legislative priority — the Digital Asset Market CLARITY Act, which would legislatively divide SEC/CFTC jurisdiction and create a comprehensive market-structure framework — remains unpassed as of this writing. The House passed its version, but the bill has stalled in the Senate, falling short of the 60 votes needed for passage, according to Holland & Knight.
Senate Republicans released a substantially revised, 630-page version of the bill on September 10, 2026, adding over 100 changes and specifically targeting “decentralized-in-name-only” protocols by requiring them to register with the CFTC, per Investing News Network. A pivotal procedural vote is scheduled for September 15, 2026, after the Senate returns from recess — but the bill already missed one legislative window in August, and CNBC reported that industry insiders, including SALT CEO John Darsie, remain skeptical of passage in 2026 given the difficulty of moving major legislation heading into midterm elections.
What Happens If CLARITY Fails
Crucially, the industry’s regulatory position does not collapse if CLARITY dies in the Senate. As CNBC’s reporting notes, “viewed from a narrow lens, the investment is already paying off, even if Clarity dies” — the SEC and CFTC have already built out much of the practical framework administratively through the MOU, the joint interpretive release, and the proposed Regulation Crypto Assets rule. Legislation would lock the framework into statute, providing durability against a future administration reversing course, but its absence would not undo the deregulatory shift already underway across every major digital-asset regulator, including the Office of the Comptroller of the Currency, which has also moved toward a looser supervisory framework for bank involvement in digital assets.
Final Verdict
The second Trump administration’s crypto policy has been unusually coordinated and fast-moving by regulatory standards: an executive order, a detailed policy report, twin agency initiatives, the first federal stablecoin law, an inter-agency MOU, a joint classification framework, and now a formal rulemaking — all within about 18 months. The remaining variable is whether Congress can convert that administrative groundwork into durable statute via the CLARITY Act, and the September 15 Senate vote is the clearest near-term test of that question. Either outcome, the substantive deregulatory shift toward “onshoring crypto to the US” is already largely in place at the regulatory level — legislation would cement it, not create it.
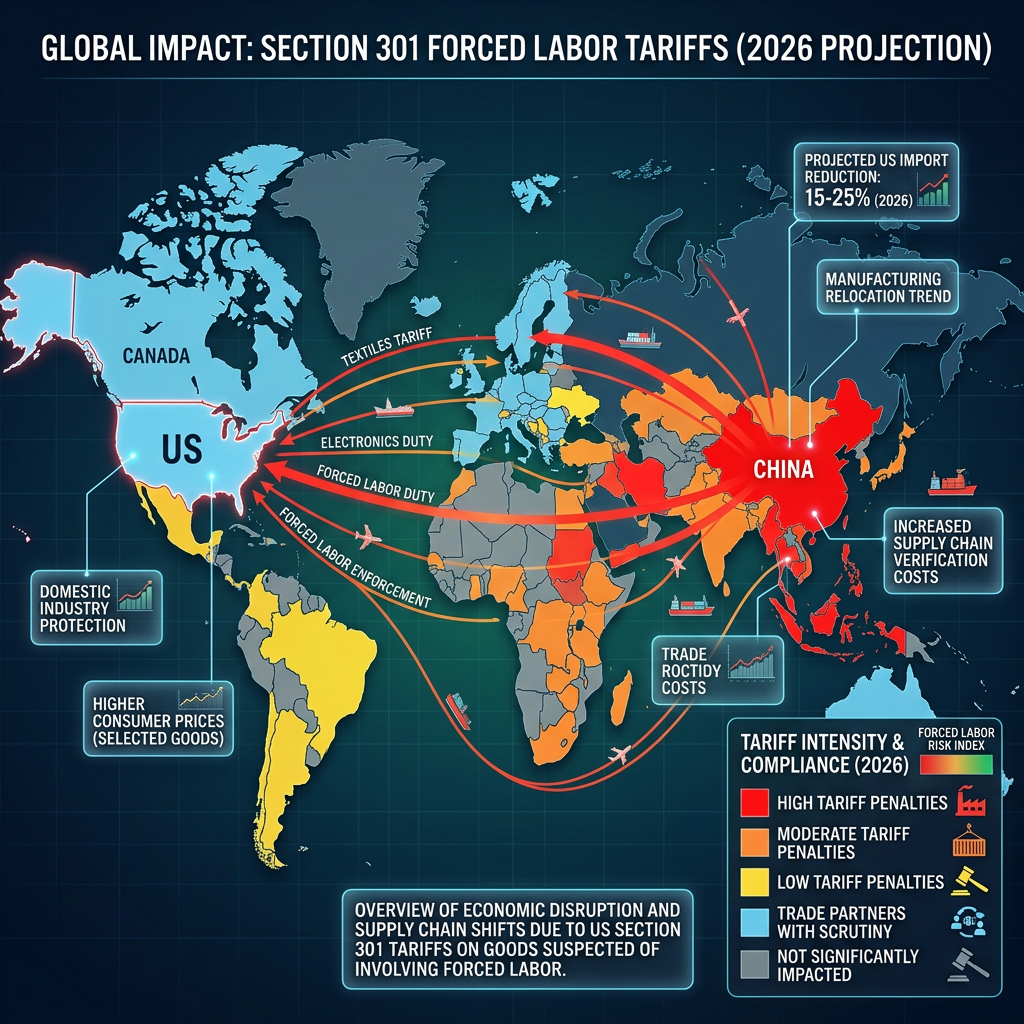
On June 2, 2026, the Office of the United States Trade Representative made a determination that quietly touches nearly every major global trading relationship at once: all 60 economies investigated for failing to adequately prohibit or enforce bans on forced-labor-produced imports were found to be acting unreasonably and burdening US commerce — with proposed tariffs of 10% to 12.5% now on the table for each (USTR).
This isn’t a fringe trade action. The 60 economies under investigation account for over 90% of all imports into the United States (Covington & Burling) — meaning this single proceeding has the potential to reshape tariff exposure across nearly the entire US import base simultaneously.
Why the Legal Framing Matters More Than the Headline
Understanding why USTR chose this specific legal pathway is essential context most coverage skips. Following a Supreme Court ruling that President Trump lacked authority to impose broad tariffs under the International Emergency Economic Powers Act (IEEPA), the administration pivoted to Section 301 of the Trade Act of 1974 — a statutory authority Congress has explicitly delegated to the executive branch for addressing unreasonable or discriminatory foreign trade practices, offering a legally sturdier foundation for longer-term tariffs than the IEEPA route that courts struck down (Covington & Burling).
That legal pivot is the real story: it signals the administration intends to build a more durable, litigation-resistant tariff architecture going forward, rather than relying on emergency powers that face ongoing court challenges.
The Two-Tier Structure, and Who Lands Where
USTR’s proposed action splits the 60 economies into two tariff tiers based on their existing forced-labor enforcement posture. Fourteen unique trading entities — including 13 countries plus the European Union — qualify for the lower 10% rate because they either maintain some form of import prohibition, operate a partial enforcement regime, or have committed to action through an Agreement on Reciprocal Trade (Green Worldwide Shipping).
The remaining 46 economies, which have neither imposed a forced labor import prohibition nor committed to establishing one, face the higher 12.5% rate.
Within the lower tier, USTR specifically identified six economies — Canada, Ecuador, the European Union, Indonesia, Mexico, and Pakistan — as jurisdictions that do maintain a forced labor import prohibition on paper, but have failed to enforce it effectively (Green Worldwide Shipping). That’s a notably diverse list spanning North America, South America, Europe, and South and Southeast Asia — underscoring that this is a genuinely global enforcement action, not one targeted at a specific region or bloc.
What USTR’s Own Report Argues Is at Stake
USTR’s underlying findings frame the economic argument in fairly direct terms: the failure to impose and enforce forced labor import prohibitions undermines global efforts to eliminate forced labor, permits firms using forced labor to produce goods at artificially lower cost, and correspondingly reduces the profitability and competitiveness of firms that don’t rely on forced labor (Green Worldwide Shipping). US Trade Representative Ambassador Jamieson Greer acknowledged some trading partners have taken initial steps — through USMCA commitments and Agreements on Reciprocal Trade — but stated each partner “must do more to ensure that trade does not perversely encourage and entrench forced labor globally” (Thompson Hine SmarTrade).
The Exemptions That Actually Determine Real-World Impact
The headline 10-12.5% figures overstate the action’s uniform impact, because the proposal includes a substantial list of carve-outs that materially change exposure depending on product category and origin. Goods listed in Annex A of the Federal Register notice — organized by Harmonized Tariff Schedule classification rather than product name — are excluded entirely. Also excluded: products already subject to Section 232 sector-specific duties, USMCA-compliant goods from Canada and Mexico, textiles and apparel entering duty-free under CAFTA-DR from Costa Rica, the Dominican Republic, El Salvador, Guatemala, Honduras, or Nicaragua, and informational materials, donations, and accompanied baggage (Covington & Burling).
USTR has also proposed a specific textile mechanism allowing a certain volume of apparel and textile imports to enter at the reduced Section 301 rate, calibrated to the volume of US-manufactured textile inputs (cotton and man-made fibers) that a given trading partner imports from the United States — effectively rewarding countries that maintain reciprocal textile trade relationships with the US (Clark Hill).
The Process Timeline and Why It Matters for Businesses Now
USTR initiated these 60 investigations on March 12, 2026, and moved through the process on what the agency has explicitly called an “accelerated timeframe.” Over the following weeks, USTR held consultations with 46 of the 60 targeted governments, received more than 450 public comments, and conducted two days of public hearings on April 28-29, 2026, with nearly 60 witnesses testifying (Green Worldwide Shipping).
The next critical dates: written public comments on the proposed actions were due July 6, 2026, and the Section 301 Committee held public hearings on the proposed action on July 7, 2026, at the US International Trade Commission in Washington (USTR). Notably, unlike prior Section 301 proceedings, USTR has not indicated it will accept post-hearing rebuttal comments in this instance — suggesting the agency intends to move toward a final determination relatively quickly once the hearing process concludes (Covington & Burling).
Crucially, no new duties are in effect yet — this remains a proposed action pending finalization. But trade law specialists are explicitly advising importers not to wait for finalization before assessing exposure, given how compressed this timeline already is compared to typical Section 301 proceedings (Clark Hill).
What Businesses Should Actually Be Doing Right Now
Trade counsel tracking this proceeding recommend a specific sequence of practical steps for import-exposed businesses. First, map exposure by country of origin and Harmonized Tariff Schedule (HTS) number specifically, pulling 2025-2026 entry data across the 60 investigated economies to identify which product lines would fall outside Annex A or other exclusions. Second, model the proposed 10% and 12.5% duties as an additional tariff layer and stress-test margin impact, pricing strategy, customer cost pass-through capacity, and import bond sufficiency. Third, don’t assume coverage or exemption without verification — confirm Section 232, USMCA, CAFTA-DR, Chapter 98, informational-materials, donation, and Annex A treatment against actual customs documentation rather than general product category assumptions (Clark Hill).
For companies with meaningful exposure, engaging directly in the comment process — either individually or through industry coalitions — remains a live opportunity to influence the final scope, exclusion list, and duty levels before USTR issues its final action.
Why This Story Deserves More Attention Than It’s Getting
Given that this single proceeding touches over 90% of US import volume, spans every major economic region this publication covers — the EU (and by extension UK-adjacent trade dynamics), Canada, Indonesia, and Pakistan are all explicitly named among the six enforcement-gap economies — and represents a structurally more durable tariff mechanism than the IEEPA approach the Supreme Court struck down, it’s genuinely surprising how little mainstream financial coverage has connected these dots into a single comprehensive picture. Most coverage to date has come from specialized trade law and customs compliance publications rather than general business media, leaving a meaningful gap for anyone trying to understand how this action might reshape global trade costs through the second half of 2026 and beyond.
The Bottom Line
The Section 301 forced labor tariff proceeding is one of the most consequential and least-covered trade policy developments of 2026, precisely because its framing — human rights enforcement rather than explicit protectionism — makes it politically harder to challenge than a straightforward tariff action, while its legal foundation under Section 301 makes it more durable than the IEEPA-based tariffs courts have already invalidated. With over 90% of US import volume affected and a compressed timeline that skipped the traditional post-hearing rebuttal period, businesses with meaningful cross-border exposure to any of the 60 named economies — which include major US trading partners across virtually every region — have a narrow and rapidly closing window to assess exposure and engage the process before these tariffs move from proposal to finalized policy.

There is a moment in every genuine geopolitical crisis when financial markets stop pretending they are merely reacting to data and begin reckoning with something more elemental: fear. That moment arrived on the morning of Saturday, February 28, 2026, when the United States and Israel launched coordinated strikes on Iran—killing Supreme Leader Ayatollah Ali Khamenei and igniting the most consequential military conflict in the Middle East in a generation. By Monday morning in New York, the world’s trading floors were measuring the aftershocks in barrels, basis points, and bullion.
What began as a targeted military operation has rapidly evolved into a multi-front conflict with cascading implications for energy markets, global supply chains, and the architecture of international finance. For investors, policymakers, and ordinary citizens watching the price of petrol rise at the pump, the central question is no longer whether markets will feel the US-Iran conflict market impact—they already are. The real question is how deep, how prolonged, and who ultimately bears the cost.
Immediate Market Reactions: Risk-Off in Real Time
The financial system’s first verdict was swift and largely predictable in its direction if not its magnitude. Stocks fell and the dollar climbed as military strikes intensified across the Middle East, sending oil to its biggest surge in four years while stoking concern that inflation will accelerate. Gold briefly topped $5,400. The S&P 500 dropped 1.1%, following losses in Europe and Asia. Airlines and cruise operators sank while energy and defense shares jumped. Bloomberg
By Monday’s open, the damage had spread more broadly. The Dow Jones Industrial Average dropped 282 points, or 0.6%. The S&P 500 lost 0.5%, and the Nasdaq Composite declined 0.4%—though the three major averages rallied off session lows as gains in technology stocks helped trim losses. At their nadir, the Dow was down about 600 points, or 1.2%. CNBC The CBOE Volatility Index—Wall Street’s so-called “fear gauge”—jumped to its highest level of 2026.
The bond market offered a counterintuitive signal. The 10-year Treasury yield was little changed Monday at 3.97%, regaining some ground after falling to an 11-month low of 3.926% on Friday. CNBC That modest move suggested bond traders are torn between two forces: a flight-to-safety impulse pulling yields lower, and an inflation anxiety—driven by soaring oil—pushing them back up. As an analyst, I’ve observed this precise tension before in conflict-driven crises: the bond market’s internal debate often telegraphs how long-lasting the disruption will prove to be.
The Strait of Hormuz: The World’s Most Expensive Bottleneck
No single geographic feature looms larger over the geopolitical risks oil prices calculation than the Strait of Hormuz. This narrow waterway between Iran and Oman is, in the words of one analyst, not a “production story” but a “chokepoint story”—and chokepoints, when threatened, carry systemic implications that dwarf any single country’s output.
More than 14 million barrels per day flowed through the Strait in 2025, or roughly a third of the world’s total seaborne crude exports. About three-quarters of those barrels went to China, India, Japan and South Korea. China, the world’s second-largest economy, receives half of its crude imports through the Strait. CNBC Iran has threatened to close this waterway entirely.
About 13 million barrels per day of crude oil transited the Strait of Hormuz in 2025, accounting for roughly 31% of global seaborne crude flows, according to market intelligence firm Kpler. CNBC Container shipping giants have already responded: Maersk announced it would suspend all vessel crossings in the Strait of Hormuz until further notice, warning that services calling ports in the Arabian Gulf may experience delays. CNBC
Amrita Sen, founder of Energy Aspects, told CNBC that oil markets are likely to hold around $80 a barrel for now after an initial spike, noting stabilization, but warned that “what the U.S. will not be able to do is control these one-off attacks on tankers.” CNBC The insurance industry is already pricing in the risk: marine hull insurance in the Gulf could rise by 25 to 50 percent in the near term, according to Dylan Mortimer, marine hull UK war leader at insurance broker Marsh. CNBC Those premiums ultimately flow through to the cost of every barrel, and every barrel’s cost flows through to every economy on earth.
Sector-Specific Impacts: Winners, Losers, and the Middle Ground
The Iran tensions global economy shock has not distributed its pain—or its windfalls—evenly across sectors. The divergence is stark.
Energy and Defense: The Reluctant Beneficiaries
Several oil stocks surged following the strikes on fears the conflict could disrupt global crude production and transport. Exxon Mobil and Chevron shares gained about 4%, while ConocoPhillips was also up more than 5%. Brent crude prices hit a new 52-week high of more than $78 on Monday. CNBC Defense contractors followed suit: Lockheed Martin shares gained 6%, while Northrop Grumman was up 5%, and drone maker AeroVironment jumped more than 10%. CNBC
Travel and Hospitality: The Immediate Casualties
Travel-related stocks dropped sharply. United Airlines, most exposed to international travel of the US carriers, tumbled more than 6%. American and Delta each fell more than 5%. Marriott International slid nearly 5%, while Airbnb sank more than 3%. Online reservation platforms Expedia and Booking Holdings slid more than 4% and 3% respectively. CNBC
The human toll on aviation has been immediate. Airlines canceled thousands of flights for the week in the Middle East, with 1,560 flights scrubbed on Monday alone, or 41.28% of those scheduled for arrival in Middle East countries, according to aviation data firm Cirium. Hundreds of thousands of passengers remain stranded. CNBC
Safe-Haven Assets: Gold’s Gravity-Defying Run
Gold’s ascent has been the defining market narrative of this crisis. Gold rallied above $5,300 per ounce, hitting record highs as investors moved into safe-haven assets. JP Morgan has raised its gold price target to $6,300 per ounce by December 2026, reflecting analyst confidence that this isn’t just a temporary spike. INDmoney Precious metals and the US dollar are now functioning as the twin shock absorbers of the global financial system.
Long-Term Risks: Inflation, Fragmentation, and the Asian Dimension
Beyond the immediate volatility lies a more structurally dangerous set of pressures. Elevated oil prices, if sustained, function as a regressive global tax—hitting emerging markets, commodity-importing nations, and lower-income households hardest.
Standard Chartered’s Global Head of Research Eric Robertsen noted that investors had already been underpricing geopolitical risk, with commodity-linked currencies outperforming, suggesting markets are paying for exposure to scarce resources and terms-of-trade winners. CNBC
The implications for Asia—the region most dependent on Hormuz-transiting oil—are severe and underappreciated by Western financial commentary. China, Japan, South Korea, and India collectively import the vast majority of their crude through this corridor. Any sustained disruption would accelerate inflationary pressures across Asian manufacturing economies, potentially stalling the global export recovery that policymakers have counted on.
There is also the geopolitical fracture dimension. China and Russia have condemned the US-Israeli strikes. In a phone call with his Russian counterpart, Chinese Foreign Minister Wang Yi said it was “unacceptable for the US and Israel to launch attacks against Iran.” CNBC This fracture carries long-term implications for dollar-denominated trade systems, multilateral institutions, and the cohesion of any post-conflict reconstruction framework.
The scenario analysis from Wells Fargo is instructive. Their strategists mapped out scenarios ranging from quick de-escalation to a worst-case prolonged Hormuz closure: in their worst-case scenario, the S&P 500 could drop to 6,000 from current levels around 6,850, but their base case still targets 7,500 by year-end. INDmoney The range of that spread—nearly 25%—is itself a measure of how genuinely uncertain the endgame remains.
The Diplomatic Paradox: War Launched During Talks
Perhaps the most jarring dimension of this crisis is the diplomatic context in which it erupted. The UN Secretary-General noted that the joint military operation by Israel and the United States occurred following indirect talks between the US and Iran mediated by Oman, “squandering an opportunity for diplomacy.” UN News
Although the last round of talks ended Thursday with Iran agreeing to “never” stockpile enriched uranium, that was not enough to avert US military action. CNN Markets loathe uncertainty, but they despise diplomatic incoherence even more—because it removes the scaffolding of predictable resolution. The absence of a clear off-ramp is precisely what is keeping risk premiums elevated across asset classes.
President Trump has suggested the conflict could last four weeks, and separately told The Atlantic that Iran’s new leadership wants to resume negotiations. Trump said Iran’s new leadership wanted to resume negotiations and that he has agreed to talk to them, saying “They want to talk, and I have agreed to talk.” CNBC Markets will be parsing every diplomatic signal for evidence of de-escalation—any credible ceasefire announcement would likely trigger a sharp oil selloff and equity recovery.
Investor Implications and Strategic Considerations
For portfolio managers navigating Middle East conflict investment strategies, several principles apply in this environment.
Overweight energy and defense selectively. The oil price tailwind for integrated majors and defense contractors is real, but entry points matter. Much of the initial upside is already priced in.
Reduce exposure to aviation, hospitality, and emerging-market importers. Nations like India, South Korea, and Japan face disproportionate energy import cost pressures, which will compress corporate margins and strain current accounts.
Monitor the Strait obsessively. David Roche of Quantum Strategy framed the market impact in terms of duration and whether Iran would attempt to close the Strait of Hormuz—if the conflict is short and contained, the risk-off move and oil spike could be brief; if it turns into a three-to-five-week regime change endeavor, markets would react “rather badly.” CNBC
Gold remains the structural hedge. With JP Morgan targeting $6,300 by year-end and central bank demand for bullion already at historical highs entering 2026, gold’s role as the geopolitical insurance policy of last resort appears set to deepen.
Conclusion: A Conflict That Will Rewrite Risk Premiums
The US-Iran conflict of February-March 2026 is not merely another geopolitical flare-up to be absorbed and forgotten within a trading week. The assassination of Khamenei, the direct involvement of US military forces, the threatened closure of the world’s most critical energy chokepoint, and the fissure it has opened between Western and non-Western powers collectively represent a structural inflection point for global markets.
In the short term, monitor Brent crude and the CBOE VIX daily as the conflict’s most sensitive barometers. In the medium term, watch whether Iran’s successor leadership follows through on negotiation signals or opts for prolonged asymmetric warfare against Gulf infrastructure. In the long term, consider how this crisis accelerates the already-underway energy transition: every $10 increase in sustainable oil prices makes renewable alternatives marginally more competitive, nudging capital allocation toward green infrastructure.
Conflict is never an opportunity to celebrate. But history teaches that periods of maximum geopolitical uncertainty are also when the contours of the next financial order begin to take shape—quietly, beneath the noise of war. The investors and institutions who read those contours correctly today will be better positioned for the world that emerges when the smoke clears over Tehran.

Trump Administration’s Crypto Policy: Deregulation and the Future of Digital Assets

Monetary Policy and the Policy Rate

Gold, Silver & Bitcoin Prices Q4 2026: Wealth Management Strategies

Business Insurance for Digital Exports: Protecting Your Company in the AI Era

Real Estate Crash Predictions 2026: Data-Backed Regional Guide

What is a “Lead-Left” Bank? Unpacking Morgan Stanley’s Role in Anthropic’s Mega-IPO

Is SPY Overvalued in September 2026? Fed Rate Hike Odds & Intrinsic Value

Pakistan’s KSE-100 Nears Record Territory Even as the Trade Gap Persists

US Consumer Sentiment Sinks as Retail Sales Drop

Barclays Q2 2026 Results: Income Beats, Costs Rise 7%

Pakistan’s Remittance Lifeline: Why Gulf Exposure Is a Hidden Risk

Dubai’s Rise to the World’s 7th Financial Hub: Inside the D33 Push

China EV Exports Hit Record High in 2026

UK’s “National Contributions Tax” Explained: Burnham-Era Reform 2026

Top 15 Stocks for Investment in 2026 in PSX: Your Complete Guide to Pakistan’s Best Investment Opportunities
Top 15 Stocks for Investment in 2026 in PSX: Your Complete Guide to Pakistan’s Best Investment Opportunities

Debunking IMF Program Myths: Reconfiguring Engagement for True National Ownership in a Volatile World

Top 10 Mutual Fund Managers in Pakistan for Investment in 2026: A Comprehensive Guide for Optimal Returns

What the U.S. Attack on Venezuela Could Mean for Oil and Canadian Crude Exports: The Economic Impact

China’s 50% Domestic Equipment Rule: The Semiconductor Mandate Reshaping Global Tech

15 Most Lucrative Sectors for Investment in Pakistan: A 2025 Data-Driven Analysis

Pakistan’s Export Goldmine: 10 Game-Changing Markets Where Pakistani Businesses Are Winning Big in 2025
15 Most Lucrative Sectors for Investment in Pakistan: A 2025 Data-Driven Analysis
15 Most Lucrative Sectors for Investment in Pakistan: A 2025 Data-Driven Analysis

Pakistan’s Stock Market Renaissance: How 2025’s Hottest Investment Opportunity Is Democratizing Wealth—A Complete Beginner’s Guide

Pakistan’s Economic Outlook 2025: Between Stabilization and the Shadow of Stagnation
Pakistan’s Economic Outlook 2025: Between Stabilization and the Shadow of Stagnation

China’s Property Woes Could Last Until 2030—Despite Beijing’s Best Censorship Efforts
-
 Markets & Finance8 months ago
Top 15 Stocks for Investment in 2026 in PSX: Your Complete Guide to Pakistan’s Best Investment Opportunities
-
Markets & Finance8 months ago
Top 15 Stocks for Investment in 2026 in PSX: Your Complete Guide to Pakistan’s Best Investment Opportunities
-
 Analysis7 months ago
Debunking IMF Program Myths: Reconfiguring Engagement for True National Ownership in a Volatile World
-
 Investment8 months ago
Top 10 Mutual Fund Managers in Pakistan for Investment in 2026: A Comprehensive Guide for Optimal Returns
-
 Global Economy8 months ago
What the U.S. Attack on Venezuela Could Mean for Oil and Canadian Crude Exports: The Economic Impact
-
 Asia9 months ago
China’s 50% Domestic Equipment Rule: The Semiconductor Mandate Reshaping Global Tech
-
 AI9 months ago
15 Most Lucrative Sectors for Investment in Pakistan: A 2025 Data-Driven Analysis
-
 Exports9 months ago
Pakistan’s Export Goldmine: 10 Game-Changing Markets Where Pakistani Businesses Are Winning Big in 2025