
Analysis
US Jobs Report Sparks Fed Rate Hike Bets (Market Analysis)


Friday morning at 8:30 AM Eastern, the consensus macroeconomic playbook was torn to shreds. Traders who had spent the past three months pricing in a gentle glide path to monetary easing watched their screens flash red as the Bureau of Labor Statistics published a headline number that defied gravity. Investors boost bets for Fed rate rise after bumper US jobs report, scrambling to offload short-dated Treasuries in a matter of seconds. The soft landing narrative, so carefully cultivated in financial media and trading desks alike, suddenly looks precariously close to a no-landing scenario.
For the better part of a year, the prevailing assumption on Wall Street was that the Federal Reserve had broken the back of inflation without breaking the labor market. Central bankers were ostensibly preparing to pivot. Yet, the sheer velocity of job creation over the past month has inverted the yield curve’s fundamental logic.
When an economy operating at full employment suddenly adds upward of 300,000 positions in a single month, the mathematics of disinflation break down. Average hourly earnings are rising faster than productivity can absorb. According to the Bureau of Labor Statistics, wage growth ticked up to 4.1% year-over-year, well above the threshold compatible with the Fed’s 2% inflation target. This isn’t a statistical anomaly. It is a structural warning sign. The bond market, notoriously unsentimental, instantly repriced the terminal rate, pricing out cuts and firmly writing a hike back into the script.
The Core Development: Sizing the Surprise
The mechanics of Friday’s repricing were brutal and instantaneous. A US jobs report Fed rate hike scenario wasn’t even on the bingo card for most institutional desks last week. Now, it is the base case.
The establishment survey revealed a staggering gain of 303,000 nonfarm payrolls, making a mockery of the 200,000 median forecast. Crucially, the gains were not isolated to cyclical sectors. Healthcare, government, and leisure and hospitality drove the headline figure, but construction and manufacturing also posted solid prints. This broad-based hiring completely ruins the argument that the economy is cooling beneath the surface. Companies are not just replacing lost talent; they are actively expanding payrolls at a pace typical of an early-cycle recovery, not a late-cycle tightening phase.
Within minutes of the release, the CME FedWatch Tool — the market’s definitive probability gauge for monetary policy — violently readjusted. The odds of the Federal Open Market Committee delivering a 25-basis-point hike at their next gathering spiked from a negligible 12% to an alarming 48%. Two-year Treasury yields, highly sensitive to near-term policy expectations, surged past 4.75%, causing severe indigestion in equity markets. By 9:00 AM, the S&P 500 futures had surrendered all their weekly gains.
The Fed is trapped by its own data dependency. When Jerome Powell took to the podium last month, he emphasized patience. That patience is now a luxury the central bank cannot afford. If employers are bidding up wages to secure scarce labor, those costs will inevitably bleed into service sector prices. Reuters market analysis confirmed that swap markets are no longer anticipating a dovish reprieve; they are bracing for a prolonged period of restrictive monetary conditions. The data forces a reckoning.
The Analytical Layer: The Phillips Curve Strikes Back
Why does a strong jobs report affect interest rates? When employers aggressively raise pay to attract scarce workers, those higher operational costs are passed directly to consumers via higher prices. The Federal Reserve uses interest rates to cool demand; accelerating job creation forces the central bank to hike rates to prevent the economy from overheating.
Still, understanding why the labor market refuses to cool requires looking past the headline numbers. Corporate America is engaged in systemic labor hoarding. Having been burned by the catastrophic talent shortages of the post-pandemic reopening, executives are refusing to shed staff even as corporate margins compress. They remember the pain of 2022, when recruiting a single mid-level software engineer took six months and a 30% premium. Today, they would rather eat the cost of carrying excess headcount than risk being caught short-handed when demand re-accelerates.
There is a distinct demographic component at play, too. The prime-age labor force participation rate has hit a two-decade high, yet the total pool of available workers is structurally constrained by an aging population. Around 10,000 baby boomers hit retirement age every single day. Companies are hiring because they fear the well will run dry if they wait.
This structural tightness makes the Fed’s traditional economic models look increasingly obsolete. The Phillips curve, which plots the inverse relationship between unemployment and inflation, is steepening. Recent findings published by the International Monetary Fund suggest that in advanced economies with entrenched labor shortages, central banks must maintain higher real rates for demonstrably longer periods to achieve the same deflationary effect. The bumper payrolls print isn’t just a sign of economic health. It is a symptom of an inelastic labor supply that threatens to anchor inflation permanently above target.
Implications & Second-Order Effects: The Dollar Wrecking Ball
The downstream consequences of a revived Federal Reserve hiking cycle will be global and severe. The immediate casualty is the foreign exchange market. A hawkish Fed automatically supercharges the US dollar, acting as a wrecking ball for foreign currencies.
Emerging markets will bear the brunt of this pain. Countries that issue dollar-denominated debt are suddenly staring at a dual crisis: a stronger greenback inflates the principal of their obligations, while higher US Treasury yields drain global liquidity away from their domestic markets. Data from the World Bank highlights that every 100-basis-point increase in US interest rates correlates with a significant contraction in capital flows to developing economies. For nations already grappling with fiscal deficits, this is a recipe for sovereign default.
Domestically, the commercial real estate sector remains the most vulnerable domino. Over $1.5 trillion in commercial mortgages are scheduled to mature over the next three years. These loans were underwritten in an era of near-zero interest rates. If the Fed is forced to hike again, or even maintain current levels well into next year, the refinancing arithmetic for office towers in Manhattan and San Francisco becomes terminal. Default rates will climb, placing renewed stress on regional banks that hold the majority of this paper.
Corporate credit markets are also on notice. High-yield issuers, previously enjoying remarkably tight spreads due to the soft-landing consensus, are suddenly exposed. The cost of capital is rising precisely when consumer purchasing power is starting to fray at the edges. A company that could comfortably service its debt at 5% will face existential questions if forced to roll over that same debt at 9%.
Competing Perspectives: The Illusion of Strength
The picture is more complicated than the hawkish narrative suggests. While the headline payroll figure commands attention, beneath the surface, the data presents glaring contradictions that should give policymakers pause before pulling the trigger on another rate rise.
A significant discrepancy exists between the establishment survey, which polls businesses, and the household survey, which polls individual citizens. While the establishment data shows explosive growth, the household survey paints a stagnating picture, occasionally pointing to outright job losses.
What follows, however, is the composition of these new jobs. A deeper dive into the BLS annex reveals that a massive proportion of the job gains over the past six months are part-time roles. Full-time employment has actually contracted in several key metrics. Multiple jobholders—individuals forced to take on second or third gigs to cope with the elevated cost of living—are heavily skewing the headline numbers. A bartender taking on weekend shifts as an Uber driver registers as two separate jobs in the establishment survey. That isn’t economic strength; that is financial distress masking itself as labor demand.
Furthermore, the birth-death model used by statisticians to estimate job creation by new businesses may be vastly overestimating reality in a high-interest-rate environment. Analysts at the Financial Times have warned that these statistical mirages often precede severe downward revisions. If the Fed hikes rates based on an illusion of part-time labor strength, they risk driving the economy into a deep, unnecessary recession. The central bank is essentially driving using the rearview mirror, and the reflection may be heavily distorted.
Closing
The Federal Reserve is staring down a brutal mandate collision. To tolerate the current pace of job creation is to tacitly accept that inflation will remain structurally elevated, abandoning the sacred 2% target. Yet, to hike rates into a heavily leveraged economy on the back of data that might be fundamentally skewed by part-time employment is to risk financial instability.
Friday’s jobs report didn’t provide clarity; it provided a mandate for market volatility. The bond vigilantes have awakened, and they are demanding higher yields as compensation for the uncertainty. The era of easy monetary answers is definitively over.



Investing in AI infrastructure—data centers, chips, and power—is particularly critical in 2026. As global economic growth diverges, capital has become far more sensitive to borrowing costs, forcing investors to look past compelling narratives and focus on realistic valuations. Rather than forecasting guaranteed returns, this guide examines key research methodologies and risk factors. According to the IMF’s October 2026 outlook, global growth is projected at 3.1% with inflation at 4.7%, even as its financial stability assessment cautions that underlying market vulnerabilities remain despite apparent resilience.
Key takeaways
- Match each investment decision to its time horizon, currency and ability to withstand losses.
- Separate observable earnings or contractual cash flows from optimistic forecasts.
- Compare diversification, fees, taxes, liquidity and regulatory restrictions before committing capital.
- Track primary institutional evidence and update assumptions when conditions change.
- Readers in Pakistan should consider rupee exposure and availability of regulated investment channels.
Why this matters now
The central question behind AI infrastructure investing 2026 is not merely what may happen next. It is which economic mechanisms could change cash flow, purchasing power or risk. The Bank for International Settlements’ 2026 review describes an economy supported by technological investment but constrained by geopolitical and fiscal pressures. A robust financial plan must therefore survive both a favourable and an adverse scenario.
Follow the investment chain, not just the headline
AI infrastructure spending flows through chips, advanced packaging, servers, networking, cooling, power equipment, real estate and utilities. Revenue can arrive at different times: hardware producers may book orders long before a data-centre tenant earns adequate cash flow from AI services. The BIS identifies AI investment as a support for recent global activity, but capital intensity can create financial fragility. See the primary institutional research.
For practical analysis, separate the baseline, the upside case and the downside case. Document the specific development that would change your assessment. Assess timing: a promising long-term theme may still be inappropriate for cash needed within twelve months.
Semiconductors: strong demand does not erase cycles
Leading-edge manufacturing is capital intensive and technically complex. Constraints in memory, packaging or fabrication can create pricing power, while capacity expansions can later produce oversupply. Compare long-term contracts, customer concentration, inventory and returns on invested capital. A rising revenue line is insufficient if shareholders continually finance new assets.
For practical analysis, separate the baseline, the upside case and the downside case. Document the specific development that would change your assessment. Assess timing: a promising long-term theme may still be inappropriate for cash needed within twelve months.
Data centres and the cost of electricity
AI computing requires secure access to electricity, transmission connections, cooling water where relevant, and backup capacity. The International Energy Agency’s Energy and AI assessment documents the central role of electricity planning. Before evaluating an operator, examine energy contracts, utilization rates, construction delays and whether customers can meet long-term commitments. See the primary institutional research.
For practical analysis, separate the baseline, the upside case and the downside case. Document the specific development that would change your assessment. Assess timing: a promising long-term theme may still be inappropriate for cash needed within twelve months.
Financing and correlated downside
The IMF warns that leveraged AI investments and concentrated exposures could magnify a valuation correction. Capital providers must distinguish contracted cash receipts from optimistic future sales estimates. Watch for circular financing, where investors and customers are economically dependent on each other’s ability to keep spending. See the primary institutional research.
For practical analysis, separate the baseline, the upside case and the downside case. Document the specific development that would change your assessment. Assess timing: a promising long-term theme may still be inappropriate for cash needed within twelve months.
Pakistan’s realistic entry points
Pakistan is unlikely to replicate an advanced-chip fabrication cluster quickly. More plausible routes include enterprise software, cybersecurity, specialised engineering, managed services and targeted power or fibre investments where the economics support them. Any local investment thesis needs reliable energy, regulatory clarity, payment rails and skills rather than the assumption that every AI project is profitable. See the primary institutional research.
For practical analysis, separate the baseline, the upside case and the downside case. Document the specific development that would change your assessment. Assess timing: a promising long-term theme may still be inappropriate for cash needed within twelve months.
Comparison and decision framework
| Question | Stronger evidence | Warning sign |
|---|---|---|
| What drives returns? | Audited cash flows, clear contract or transparent index | Undefined or projected returns |
| What can go wrong? | Explicit scenario and downside analysis | Claims of guaranteed gains |
| Is it affordable to hold? | Low transparent fees and adequate liquidity | Leverage, costly spreads or lockups |
| Is access legitimate? | Appropriate licensing and clear legal rights | Unverified brokers or custody |
| Is the exposure diversified? | Multiple independent sources of return | One company, sector or currency |
What it means for Pakistani savers and investors
A Pakistani reader faces both international investment risk and local purchasing-power risk. For example, a foreign asset can rise in US-dollar terms while the rupee conversion and transaction costs alter the realized local outcome. The opposite can also occur. Record the starting exchange rate, applicable taxes, custody charges and capital-transfer restrictions, and confirm current requirements with the State Bank of Pakistan and the relevant securities regulator. Overseas access should not be assumed universally available.
An emergency reserve, expensive consumer debt and near-term family obligations deserve attention before any speculative allocation. A portfolio that cannot meet a sudden cash requirement may force sales at the worst moment. The objective is not to remove risk—impossible in markets—but to choose risks that fit the investor’s actual liabilities.
Risks, limitations and uncertainty
Institutional forecasts are conditional and can change after policy decisions, commodity shocks, conflict escalation or unexpectedly weak earnings. Historic correlations are not binding promises about future asset performance. The analysis does not provide live stock prices, current investment product quotes, real-time exchange rates or individualized tax advice. Prices, regulations and product eligibility should be checked on the transaction date.
Frequently asked questions
Is this a guaranteed investment opportunity?
No. Every financial asset or strategy involves uncertainty. The existence of a popular investment theme is not evidence that an individual security is fairly priced.
What should beginners examine first?
Understand the product, the financial loss you could tolerate, fees and liquidity. Verify the provider and decide whether the money may be needed soon.
How do interest rates affect the analysis?
They influence financing costs, discount rates, exchange rates and demand. The effect differs by sector, maturity and business balance sheet.
Can Pakistani residents invest in foreign markets?
Access depends on current foreign-exchange, banking, brokerage, securities and tax rules, and on the investor’s individual circumstances. Check current regulations and regulated providers rather than assuming access.
How often should this analysis be refreshed?
Review institutional economic releases monthly and re-evaluate immediately after material earnings, regulatory or policy changes. Avoid reacting mechanically to every daily market movement.
Is diversification enough to prevent losses?
No. Diversification may reduce company-specific risk but cannot eliminate broad market, currency, inflation or systemic risks.
Conclusion
Sound financial decisions begin with verifiable evidence, reasonable valuation, awareness of uncertainty and a plan that survives adverse outcomes. Readers should compare multiple independent sources and avoid letting a compelling headline substitute for due diligence.

Almost every support team is now using AI. Far fewer customers say it solves their problem. That gap is the real story of AI customer service in 2026, and it decides which deployments pay off.
Key Takeaways
- Adoption doubled fast: Salesforce’s May 2026 survey of 3,075 service professionals found AI agent adoption rose from 39% to 66% in a year. getmacha
- Results lag: Only 24% of consumers said their last AI service interaction was fully resolved by AI alone, per an Ada and NewtonX study. getmacha
- Value shows up quickly: 70% of organizations deploying agents saw measurable value within 60 days. agilebrandguide
- Data is the blocker: 72% of service operations professionals call data readiness a major obstacle. agilebrandguide
- Forecast: Gartner expects agentic AI to autonomously resolve 80% of common customer service issues by 2029. raftlabs
What “AI Customer Service” Means Now
The first wave was scripted chatbots. The current wave is agentic AI: systems that interpret open-ended intent, read live customer data and resolve issues across connected systems without following a script. cygnet
The difference is action. A chatbot answers “where’s my order?” An agent checks the order system, issues the refund and updates the CRM.
The Adoption Numbers
| Metric | Figure | Source |
|---|---|---|
| Service orgs using AI agents | 66% (up from 39%) | Salesforce, May 2026 |
| Orgs using at least one form of AI | 85% | Salesforce |
| Teams at mature AI deployment | 10% | Intercom, Jan 2026 |
| Consumers fully resolved by AI alone | 24% | Ada/NewtonX, Mar 2026 |
| Agent use across customer-facing and internal work | 77% | Salesforce |
One caution applies to the headline adoption figures: Salesforce sells AI agents for service, so it has a commercial reason to publish momentum numbers. The Salesforce data is useful, but read it as a vendor’s view. Salesforce’s own service product page promotes the AI Agents Edition report, if you want to see how it frames the findings. getmacha
The Trust Gap
The most important number in this market isn’t adoption. It’s the 24% full-resolution rate. Companies are deploying AI faster than customers are being helped by it.
One compilation of 2026 statistics adds that 64% of customers wish companies would stop using AI in customer service, according to a Lorikeet survey. That’s a single-vendor figure, so use it as a directional signal rather than a settled fact. It still matches what most people have experienced: the bot that can’t escalate, the loop that never reaches a human. coworker
Where AI service typically fails:
- No escalation path: The customer can’t reach a person.
- Stale or fragmented data: The agent can’t see order history or account status.
- Overreach: The agent attempts complex or emotional cases it shouldn’t.
- Hidden AI: Customers feel tricked when they don’t know it’s a bot.
Where It Works
AI customer service performs best on narrow, high-volume, low-emotion requests: order status, password resets, returns and refunds, appointment changes and billing questions. 95% of service professionals say they trust AI for simple requests. Trust drops sharply as complexity rises. agilebrandguide
The ROI Question
Return figures vary widely. One 2026 compilation puts average ROI at $3.50 for every $1 spent, with leading organizations reaching 8x. Treat those as ceilings, not promises. The same compilation also notes 62% of service leaders worry about unpredictable AI costs. Usage-based pricing can erase savings if volume spikes. ringlyringly
A practical ROI model needs four inputs:
- Containment rate: Share of contacts fully resolved without a human
- Cost per contact: Human-handled versus AI-handled
- Quality impact: CSAT and repeat-contact rate, not just deflection
- Total AI cost: Licenses, usage fees, integration and ongoing tuning
Deflection that frustrates customers is a hidden cost. If containment rises while CSAT falls, you’re borrowing against retention.
Platform Landscape
Enterprise buyers commonly compare these platforms: Salesforce Agentforce, IBM watsonx Assistant, Microsoft Copilot Studio, Cognigy and Kore.ai. Each has strengths, so match the platform to your stack: cygnet
| If you already run… | Consider first |
|---|---|
| Salesforce CRM | Agentforce |
| Microsoft 365 and Dynamics | Copilot Studio |
| Heavy voice and contact-center volume | Cognigy |
| Multi-function (support, IT, HR) automation | Kore.ai |
| Regulated or hybrid environments | IBM watsonx Assistant |
This table is a starting framework, not a ranking. Integration depth with your CRM and ticketing systems usually matters more than headline features.
What the Workforce Impact Looks Like
Estimates of job impact are speculative and vary by source. One forecast says Gartner predicts organizations will replace 20% to 30% of service agents with generative AI by 2026. What’s more certain is that roles change: simpler tickets disappear, and humans handle harder, more emotional cases. That requires different training and often different pay structures. raftlabs
A Buyer’s Checklist
Before signing a contract, answer these:
- Data readiness: Is customer data clean, unified and accessible to the agent?
- Escalation design: Can customers reach a human in one step?
- Transparency: Do customers know they’re talking to AI?
- Governance: Who audits agent decisions and refunds?
- Metrics: Are you tracking resolution and CSAT, not only deflection?
- Pricing: What happens to cost when volume doubles?
What’s Next
Salesforce’s research frames the next phase around governance and workforce roles, recommending clear roles for AI architects and data specialists, plus transparent interactions with clear escalation to humans. That advice is sensible regardless of vendor. agilebrandguide
The Bottom Line
AI customer service works when it’s narrow, well-fed with data and honest about its limits. It fails when companies treat it as a headcount-cutting shortcut. With adoption now past 60%, competitive advantage will come less from having AI and more from deploying it without losing customer trust. Start with simple, high-volume requests, measure resolution rather than deflection, and keep a human exit visible.
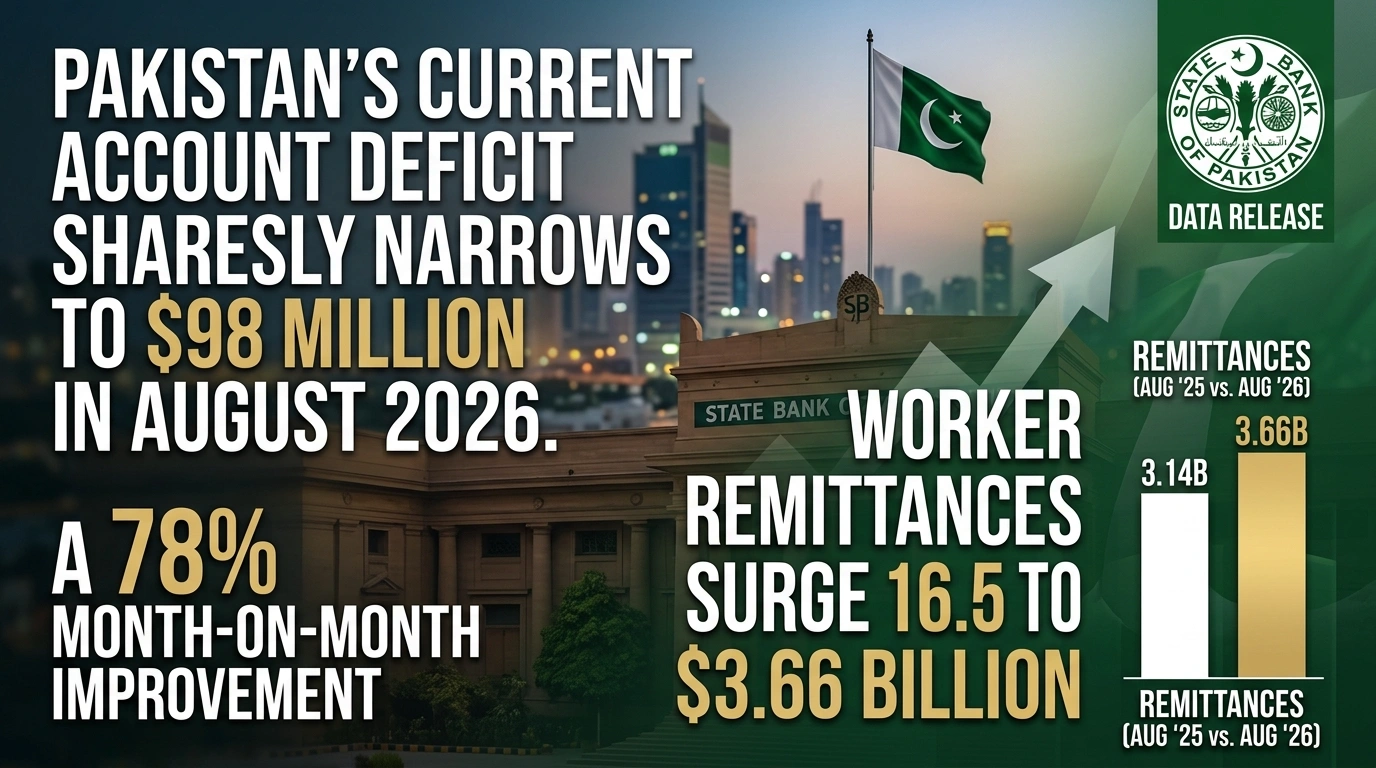
Karachi — Pakistan’s external balance demonstrated significant resilience as the monthly Current Account Deficit (CAD) contracted sharply to $98 million in August 2026, down 78% month-on-month from $445 million recorded in July 2026. Official data released by the State Bank of Pakistan (SBP) highlights that strong worker remittance inflows and steady export growth offset a surging import bill, providing crucial relief to the nation’s balance of payments.
Compared to the same period last year, the monthly shortfall narrowed by 69.7.3% from the $324 million deficit registered in August 2025. Cumulatively, during the first two months of the current fiscal year (2MFY27), Pakistan’s current account deficit stood at $543 million, marking a 36.3% reduction compared to the $853 million deficit incurred in 2MFY26, according to official economic indicators compiled by Dawn News Financial Analysis.
Key Drivers Behind August 2026 External Account Performance
1. Robust Remittance Inflows as the Core Anchor
Overseas Pakistani workers remitted $3.656 billion during August 2026, registering a 16.5% year-on-year (YoY) increase compared to $3.14 billion in August 2025 and a 0.7% month-on-month growth over July’s $3.63 billion.
- Saudi Arabia: Remained the largest contributor, accounting for $873.5 million (+19% YoY).
- United Arab Emirates (UAE): Inflows rose to $749.8 million (+17% YoY).
- United Kingdom & EU: Remittances from the UK totaled $563.7 million (+22% YoY), while European Union corridors dispatched $496 million (+7% MoM).
- United States: Inflows reached $308.9 million (+16% YoY).
Cumulative remittance inflows for 2MFY27 reached $7.29 billion, representing a 14.7% YoY increase from $6.36 billion recorded during the same period in FY26, as reported by Express Tribune Business.
2. Trade Balance and Import-Export Dynamics
- Exports of Goods & Services: Reached $3.33 billion in August 2026, reflecting a 5.0% YoY rise compared to $3.17 billion in August 2025.
- Imports of Goods & Services: Expanded to $6.64 billion, an increase of 8.0% YoY from $6.15 billion in August 2025, driven largely by essential industrial raw materials and energy imports required to support ongoing economic revival.
Macroeconomic Comparison Matrix: Current Account Breakdown
The table below illustrates the shift across key trade and primary income metrics for Pakistan’s balance of payments, as monitored by Trading Economics – Pakistan Balance of Payments:
| Economic Metric | August 2026 | July 2026 | August 2025 | 2MFY27 Cumulative | 2MFY26 Cumulative | YoY Shift (%) |
| Current Account Balance | -$98M | -$445M | -$324M | -$543M | -$853M | -36.3% |
| Worker Remittances | $3.656B | $3.630B | $3.140B | $7.286B | $6.353B | +14.7% |
| Total Exports (Goods & Services) | $3.330B | $3.180B | $3.170B | $6.510B | $6.120B | +6.37% |
| Total Imports (Goods & Services) | $6.640B | $6.520B | $6.150B | $13.160B | $12.380B | +6.30% |
| Foreign Exchange Reserves (Excl. CRR) | $17.280B | $16.900B | $14.520B | $17.280B | $14.520B | +19.0% |
| Net Foreign Direct Investment (FDI) | $315.9M | $185.2M | $175.1M | $501.1M | $342.0M | +46.5% |
Exchange Rate Competitiveness & FDI Momentum
REER and NEER Movements
Alongside the current account update, SBP data revealed that Pakistan’s Real Effective Exchange Rate (REER) index recorded a minor increase of 0.02% MoM, reaching 107.92 in August 2026 compared to 107.89 in July 2026.
Meanwhile, the Nominal Effective Exchange Rate (NEER) index depreciated by 0.79% MoM to 38.02 in August from 38.32 in July. While a REER above 100 indicates mild export price pressure, analysts cited by Reuters Global Markets note that exchange rate stability has helped maintain import predictability without severely penalizing key manufacturing sectors.
Surge in Foreign Direct Investment
Net Foreign Direct Investment (FDI) inflows saw a sharp increase, totaling $315.9 million in August 2026—an 80.4% YoY expansion compared to $175.1 million in August 2025. Key capital inflows targeted energy, telecommunications, and infrastructure projects, underscoring rising investor confidence supported by ongoing fiscal discipline and structural economic reforms monitored by Bloomberg Markets.
Macroeconomic Implications & Policy Outlook
- Foreign Reserve Buffer Expansion: Total SBP-held foreign exchange reserves (excluding CRR/SCRR) expanded to $17.28 billion, an increase of 19% YoY. This build-up strengthens Pakistan’s external liquidity buffer, providing over 2.6 months of import cover.
- Impact on Monetary Policy: The narrowing CAD and stable exchange rate dynamics offer the State Bank of Pakistan headroom to maintain a measured monetary easing cycle, encouraging domestic capital formation without reigniting demand-pull inflation.
- IMF Program Benchmark Compliance: Lower current account vulnerabilities position Pakistan favorably for ongoing review under international financial assistance programs, ensuring sustained access to multilateral funding channels.

AI Infrastructure Investment Strategies for 2026

Pakistan Freelancers Tax 2026: Payments, Documentation and Formal Growth

Strait of Hormuz Crisis: What the Latest Tanker Attacks Mean for Oil, Shipping and Global Trade

AI Customer Service in 2026: What’s Working, What’s Failing, and What to Buy

Open a Savings Account Online: How to Actually Earn 10x the National Average Rate

Global Housing Market 2026: Where Prices Rise, Where They Don’t

PSX and KSE-100 Record Highs: An Insider’s Guide to Pakistan Stocks

So Delicious Dessert Recall: Affected Products, FDA Guidelines, and Consumer Action

Pakistan’s Current Account Deficit Narrows Sharply to $98 Million in August 2026

Japan Eyes 3.5% Defense Spending: What It Means for Bonds, Stocks, and the BOJ

PSX & KSE Forecast 2026: Navigating the Latest IMF Reports & World Bank Metrics

Trump Administration’s Crypto Policy: Deregulation and the Future of Digital Assets

Monetary Policy and the Policy Rate

Gold, Silver & Bitcoin Prices Q4 2026: Wealth Management Strategies

Top 15 Stocks for Investment in 2026 in PSX: Your Complete Guide to Pakistan’s Best Investment Opportunities
Top 15 Stocks for Investment in 2026 in PSX: Your Complete Guide to Pakistan’s Best Investment Opportunities

Debunking IMF Program Myths: Reconfiguring Engagement for True National Ownership in a Volatile World

Top 10 Mutual Fund Managers in Pakistan for Investment in 2026: A Comprehensive Guide for Optimal Returns

China’s 50% Domestic Equipment Rule: The Semiconductor Mandate Reshaping Global Tech

What the U.S. Attack on Venezuela Could Mean for Oil and Canadian Crude Exports: The Economic Impact

15 Most Lucrative Sectors for Investment in Pakistan: A 2025 Data-Driven Analysis

Pakistan’s Export Goldmine: 10 Game-Changing Markets Where Pakistani Businesses Are Winning Big in 2025
15 Most Lucrative Sectors for Investment in Pakistan: A 2025 Data-Driven Analysis

Pakistan’s Stock Market Renaissance: How 2025’s Hottest Investment Opportunity Is Democratizing Wealth—A Complete Beginner’s Guide
15 Most Lucrative Sectors for Investment in Pakistan: A 2025 Data-Driven Analysis

How to Become an Active Taxpayer on Pakistan’s FBR Active Taxpayer List (ATL) in 2026: A Step-by-Step Guide

Pakistan’s Economic Outlook 2025: Between Stabilization and the Shadow of Stagnation

Best Investments in Pakistan 2026: Top 10 Low-Price Shares and Long-Term Picks for the PSX
-
 Markets & Finance10 months ago
Top 15 Stocks for Investment in 2026 in PSX: Your Complete Guide to Pakistan’s Best Investment Opportunities
-
Markets & Finance10 months ago
Top 15 Stocks for Investment in 2026 in PSX: Your Complete Guide to Pakistan’s Best Investment Opportunities
-
 Analysis9 months ago
Debunking IMF Program Myths: Reconfiguring Engagement for True National Ownership in a Volatile World
-
 Investment9 months ago
Top 10 Mutual Fund Managers in Pakistan for Investment in 2026: A Comprehensive Guide for Optimal Returns
-
 Asia10 months ago
China’s 50% Domestic Equipment Rule: The Semiconductor Mandate Reshaping Global Tech
-
 Global Economy10 months ago
What the U.S. Attack on Venezuela Could Mean for Oil and Canadian Crude Exports: The Economic Impact
-
 AI10 months ago
15 Most Lucrative Sectors for Investment in Pakistan: A 2025 Data-Driven Analysis
-
 Exports10 months ago
Pakistan’s Export Goldmine: 10 Game-Changing Markets Where Pakistani Businesses Are Winning Big in 2025