
Global Economy
The $250 Billion Gamble: How Trump’s Tariff Experiment Is Reshaping the American Economy

Inside the most dramatic restructuring of US trade policy since the Great Depression—and what it means for your wallet, your job, and the future of global commerce
When Wall Street erased over $2 trillion in market capitalization during the first week of April 2025, traders weren’t reacting to corporate earnings, interest rate moves, or geopolitical crises. They were responding to something far more fundamental: the largest restructuring of American trade policy in nearly a century. President Donald Trump’s “Liberation Day” announcement on April 2nd introduced tariffs so sweeping that the average effective tariff rate climbed from 2.5% to 17%—levels unseen since 1935, when the scars of the Smoot-Hawley Tariff Act still stung the global economy.
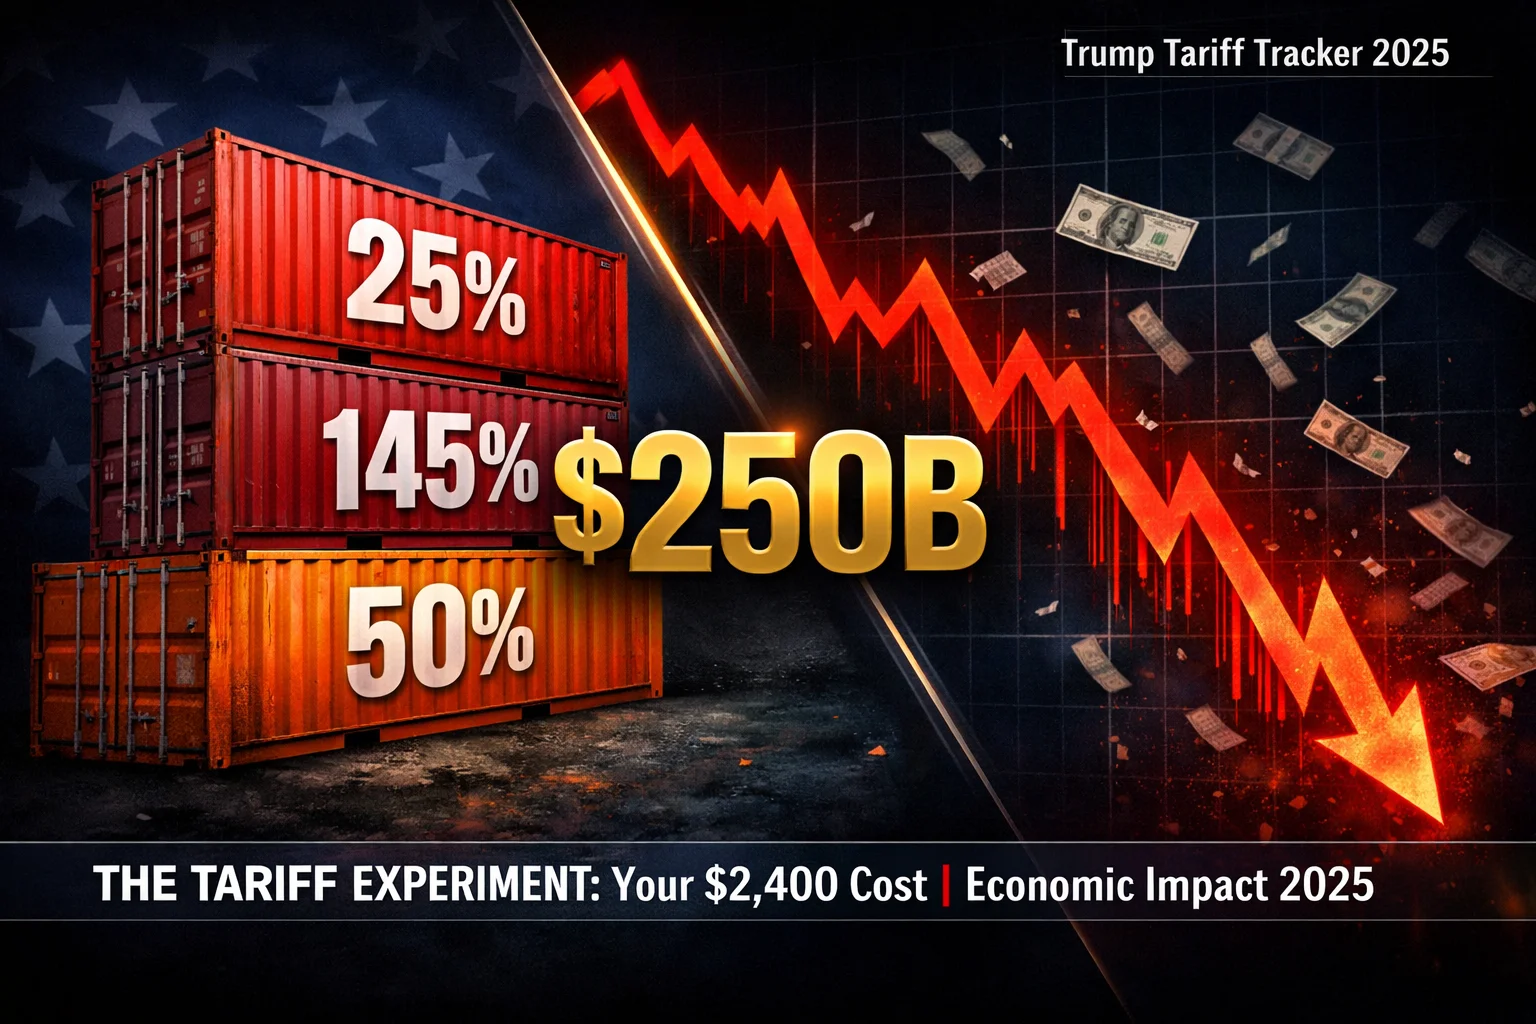
Nearly nine months into this unprecedented experiment in economic nationalism, the results are in—and they’re more complex than either tariff enthusiasts or free trade purists predicted. With $250 billion in tariff revenue collected through December 2025 and fundamental shifts underway in global supply chains, corporate strategy, and household budgets, we’re witnessing an economic transformation whose consequences will reverberate for years.
The stakes couldn’t be higher. For middle-class families facing an estimated $2,400 annual tariff burden, for manufacturers recalculating decades-old supply chain decisions, and for investors navigating the most volatile market environment since 2020, understanding this seismic shift isn’t optional—it’s essential.
The Tariff Landscape: A Comprehensive Chronicle
The Trump administration’s tariff architecture didn’t emerge overnight. It evolved through a series of escalating actions that began cautiously in February 2025 and exploded into a full-scale trade realignment by spring.
On February 1st, Trump fired the opening salvo: a 25% tariff on Canadian and Mexican goods and 10% on Chinese imports, citing concerns over fentanyl trafficking and illegal immigration. After intense backlash and market jitters, he granted a 30-day reprieve for Canada and Mexico while the 10% China tariff took effect on February 4th. China immediately retaliated with its own duties on American products, setting the stage for months of tit-for-tat escalation.
By March 4th, the gloves came off. The full 25% tariff on Canada and Mexico took effect, though automotive products received a one-month carve-out. Canada responded by slapping 25% duties on roughly $30 billion worth of US goods, including agricultural products that would devastate American farmers. The same day, Trump doubled down on China, raising the tariff from 10% to 20%, then to 34% by early April.
How Trump’s Tariffs Affect Your Wallet in 2025
Trump’s tariff regime—the most aggressive in 90 years—is costing the average American household $2,400 annually through higher prices on everyday goods. With $250 billion collected in tariff revenue but GDP projected to decline 0.4-6%, the economic experiment has created more costs than benefits for middle-class families.
💰 Quick Impact Summary:
Your Household: $2,400/year additional cost (3% of median income)
Tariff Rate: 16.8% average (up from 2.5% in 2024) — highest since 1935
🛒 Price Increases You’re Paying:
- Bananas: +4.9% (April-August)
- Coffee: +15% annualized
- Cars: +11.4% projected
- Jewelry/Watches: +5.5% (August)
- Furniture & Appliances: +5.5%
📈 Economic Ripple Effects:
- Inflation boost: +0.5 to 1.5 percentage points
- Trade coverage: 71% of all US imports
- Job losses: 4,100+ in freight/logistics
- Market volatility: $2 trillion erased in April crash
- Manufacturing jobs: Modest gains offset by supply chain losses
💸 The Real Long-Term Cost:
Economists at Penn Wharton Budget Model project middle-income households will lose $22,000 in lifetime income—roughly equivalent to two years of retirement savings for typical American families.
But the real earthquake came on April 2nd—”Liberation Day,” as Trump christened it. Invoking the rarely-used International Emergency Economic Powers Act, he declared America’s trade deficit a national emergency and imposed a baseline 10% tariff on virtually all imports. Country-specific rates soared higher: 34% on China, 20% on the European Union, 27% on India, 24% on Japan, 26% on South Korea, and a staggering 46% on Vietnam.
The announcement triggered what would become known as the 2025 stock market crash. The S&P 500 plummeted more than 10% in two days, wiping out trillions in household wealth. Bond yields spiked as investors questioned US fiscal stability. Within a week, Trump blinked—announcing a 90-day pause on the country-specific tariffs while keeping the 10% baseline and dramatically increasing pressure on China to 145% (though this was later clarified and adjusted).
The subsequent months brought a dizzying array of adjustments. Steel and aluminum tariffs hit 50% under Section 232 authority. Copper faced a proposed 50% levy. Switzerland’s watches saw rates climb to 39%. Brazil, initially subject to moderate duties, found itself facing 50% tariffs by August after diplomatic tensions flared. By November, as legal challenges wound through federal courts and trade negotiations produced tentative deals with select partners, the average effective tariff rate settled at approximately 16.8%—still the highest in over eight decades.
According to data from the Congressional Research Service and Atlantic Council’s Trump Tariff Tracker, these measures now cover roughly $2.3 trillion in goods, representing 71% of all US imports. US Customs and Border Protection reports collecting over $200 billion specifically from Trump’s new tariffs between January 20 and December 15, 2025—a figure that doesn’t include legacy tariffs from his first term.
Economic Impact: Where Theory Meets Reality
The macroeconomic consequences of this tariff regime have defied simple predictions. While Trump administration officials promised a manufacturing renaissance and fiscal windfall, and critics warned of immediate economic collapse, the reality has been more nuanced—and more troubling in specific sectors.
GDP and Growth Trajectories
Economic modeling from the Penn Wharton Budget Model projects the tariffs will reduce long-run GDP by approximately 6%, with middle-income households facing a $22,000 lifetime income loss. These losses, according to Wharton researchers, are roughly twice as damaging as a revenue-equivalent corporate tax increase from 21% to 36%—itself considered highly distortionary.
The Peterson Institute for International Economics found that under current tariff levels, US real GDP would decline by 0.4% relative to baseline by 2026, with permanent annual losses thereafter due to the persistent efficiency costs. JP Morgan Global Research slashed its 2025 GDP growth forecast from 2.1% to 1.4% by Q4, citing tariff uncertainty and supply chain disruption.
Yet paradoxically, actual GDP growth has shown remarkable resilience in certain quarters. The third quarter of 2025 saw robust 4.3% annualized growth, driven primarily by consumer spending on healthcare and services. This resilience masks significant sectoral pain and may reflect temporary stockpiling effects rather than sustainable momentum.
The Inflation Conundrum
Tariffs function as consumption taxes, raising prices on imported goods and, through reduced competition, on domestic substitutes. The inflationary impact has materialized gradually but persistently across multiple categories.
Tax Foundation analysis indicates the tariffs amount to an average tax increase of $1,100 per household in 2025, rising to $1,400 in 2026. JP Morgan economists estimate Personal Consumption Expenditures (PCE) prices increased by 1.0-1.5 percentage points specifically due to tariffs, with effects concentrated in the middle quarters of 2025.
Federal Reserve data from St. Louis shows tariffs explaining roughly 0.5 percentage points of headline PCE inflation between June and August. While this may seem modest, it represents a meaningful share of total inflation running at 2.7-3.0%—well above the Fed’s 2% target and making monetary policy considerably more difficult.
Specific product categories tell a starker story. According to Harvard Business School’s Pricing Lab, prices for imported goods rose 4.0% between March and September 2025, double the 2.0% increase for domestic goods. Bananas—virtually all imported from Central and South America—saw prices climb 4.9% from April through August, an annualized pace of 15%. Coffee prices surged as tariffs on major suppliers like Vietnam (raised sharply), Indonesia, and Brazil (hit with 50% duties in August) disrupted a market where the US grows less than 1% of consumption.
Jewelry and watches experienced a 5.5% jump in August alone, far above the historical 0.8% monthly average, driven by the 39% tariff on Swiss imports. Toys, furniture, appliances, and apparel have all shown above-trend inflation. Yale Budget Lab estimates the effective tariff rate peaked at 28% in April—the highest since 1901—before moderating to 17.4% by year-end as trade patterns adjusted.
Employment and Manufacturing: The Unfulfilled Promise
One of Trump’s central justifications for tariffs was restoring American manufacturing jobs. The data suggests a more complicated picture, with modest gains in protected sectors offset by significant losses in trade-exposed industries.
Peterson Institute modeling indicates employment measured as hours worked would decline in sectors most exposed to trade, with the biggest drops in durable goods manufacturing, mining, and agriculture. The promised manufacturing boom has largely failed to materialize; instead, jobs growth slowed significantly in 2025 compared to 2024.
The freight and logistics sector—a bellwether for manufacturing activity—has hemorrhaged over 4,100 jobs in recent months. Major truck manufacturers have announced layoffs citing weak demand, declining orders, and uncertainty over tariffs and regulations. Agricultural exports, particularly soybeans and pork, have plummeted due to retaliatory tariffs, devastating farming communities across the Midwest.
The Tax Foundation projects the IEEPA tariffs alone will reduce US employment by significant margins, though exact figures vary by scenario. What’s clear is that tariff protection for steel and aluminum workers hasn’t translated into broader manufacturing employment gains, as downstream industries that use these materials as inputs—automotive, construction, machinery—face higher costs that reduce their competitiveness.
Financial Markets: Volatility as the New Normal
Perhaps no aspect of the tariff regime has been more visible than its impact on financial markets. The April 2025 stock market crash ranks among the most severe declines since the COVID-19 pandemic, with the S&P 500 experiencing its largest daily and weekly swings of the year during tariff announcements.
Research published in finance journals shows tariffs and trade policy uncertainty collectively explain up to 7.9%, 8.2%, and 9.9% of forecast error variance for the S&P 500, Nasdaq, and Dow Jones respectively. BlackRock analysis found that low-volatility strategies significantly outperformed during the April drawdown, with minimum volatility ETFs falling only half as much as the broader market.
The bond market has experienced its own turmoil. As stocks initially declined in April, investors fled to Treasury bonds, pushing yields down. Trump touted this as evidence his policies were lowering borrowing costs. But the trend reversed sharply as bond markets began experiencing widespread selling—an example of bond vigilantism reflecting waning confidence in US fiscal policy. The 10-year Treasury yield, which helps set mortgage and credit card rates, spiked before easing but remains elevated relative to early 2025 levels.
Council on Foreign Relations analysis highlights how tariffs create hidden costs for the Treasury market through three channels: increased bond supply (as deficits persist despite tariff revenue), reduced foreign demand (as trade relationships deteriorate), and adverse effects on growth and inflation that push yields higher.
Despite the tumult, markets have shown resilience. Through December 11th, the S&P 500 returned over 18% for the year, the third consecutive year of double-digit gains. This recovery reflects the economy’s underlying strength, Federal Reserve rate cuts, and investor adaptation to policy uncertainty. Yet each major tariff announcement continues to trigger volatility, keeping strategists and investors in a constant state of anticipation.
Winners and Losers: The Uneven Distribution of Costs
Trade policy always creates winners and losers. Understanding who benefits and who pays is essential for evaluating the tariff regime’s ultimate success or failure.
The Winners: Narrow Gains
Certain domestic manufacturers in heavily protected sectors have benefited. American steel and aluminum producers have seen improved pricing power and reduced foreign competition, though this comes at the expense of downstream users. Some firms previously considering offshoring have announced plans to expand US production, though these remain modest compared to overall manufacturing investment.
The federal Treasury has been an undeniable winner, at least on paper. The $250 billion in tariff collections represents a significant revenue stream, constituting 7.5% of total federal revenue by December 2025—far more than typical customs duties. Trump has suggested these revenues could eventually replace income taxes, though economists universally dismiss this as mathematically impossible given that tariff revenues would need to be 4-5 times larger to offset income tax collections.
Countries benefiting from trade diversion—particularly Vietnam, Mexico, Taiwan, and India—have seen export growth as companies shift supply chains away from China. Mexico’s imports to the US actually increased year-to-date despite tariffs, as USMCA provisions provide some protection and proximity offers advantages.
The Losers: Widespread Pain
The costs are far more diffuse and consequential. Middle-class consumers face the most direct impact through higher prices on everyday goods. Yale Budget Lab’s $2,400 annual household cost estimate represents roughly 3% of median household income—a meaningful reduction in purchasing power that hits hardest at families already struggling with inflation.
Small businesses that rely on imports have been particularly vulnerable. Reports indicate the typical small importer faced more than $90,000 in additional tariff costs from April through July 2025 alone, with revenue losses averaging 13%. Many lack the scale or market power to negotiate with suppliers or pass costs to customers, forcing them to absorb the hit to margins or scale back operations.
Export-dependent industries have suffered enormously from retaliatory measures. American farmers have watched soybean exports to China collapse and pork shipments face prohibitive duties. Agricultural export losses have compounded existing challenges in rural America, prompting emergency aid packages that reduce the net fiscal benefit of tariff revenues.
The automotive sector exemplifies the complex pain. US automakers—Ford, General Motors, and Stellantis—lobbied aggressively against tariffs, warning they would inflict more harm on American companies than foreign competitors due to deeply integrated North American supply chains. JP Morgan Research estimated light vehicle prices could rise by as much as 11.4% if automakers successfully pass costs to consumers, a development that would devastate sales volumes.
Geopolitically, the tariff regime has strained alliances. European Union members have announced countermeasures and struggled to maintain unity in responding to US actions. The USMCA, barely five years old, faces an uncertain future with its 2026 review approaching. Trust in the rules-based trading system—a pillar of American economic influence—has eroded as the US demonstrates willingness to unilaterally rewrite trade rules.
The Uncertainty Tax: Policy Volatility as Economic Headwind
Beyond the direct costs of tariffs lies a more insidious problem: the economic damage caused by sheer unpredictability. Businesses make capital allocation decisions based on expected future conditions. When those conditions shift wildly—with tariffs announced, paused, raised, lowered, and restructured with dizzying frequency—investment freezes.
Capital expenditure data shows businesses delaying major decisions throughout 2025. CFO confidence surveys have plummeted, with executives citing policy uncertainty as a primary concern. The Peterson Institute’s modeling explicitly accounts for this uncertainty premium, finding it amplifies economic losses beyond the tariffs themselves.
Historical parallels are ominous. The Smoot-Hawley Tariff Act of 1930 contributed to the Great Depression not solely through its direct effects but through the uncertainty and retaliation it triggered, causing trade to collapse by 66% between 1929 and 1934. While current circumstances differ dramatically—the US economy is far more diversified and resilient—the mechanism of uncertainty-driven contraction remains relevant.
Federal Reserve testimony has highlighted how tariff unpredictability hampers monetary policy. The Fed must balance supporting growth against controlling inflation, but when tariffs might suddenly increase prices by an unknown amount, calibrating interest rate policy becomes extraordinarily difficult. Chair Jerome Powell has publicly noted that markets are “struggling with a lot of uncertainty and that means volatility.”
This uncertainty has real costs. Research from the Federal Reserve Bank of Atlanta found businesses—both those directly exposed to tariffs and those who are not—sharply increased their price expectations by mid-May 2025, jumping from 2.5% anticipated price growth to 3.5%. The anticipation of future cost increases can be as damaging as the increases themselves, as businesses price in risk premiums and consumers alter spending patterns.
What Comes Next: Three Plausible Scenarios
As we enter 2026, three distinct scenarios capture the range of possible outcomes for US trade policy and the economy.
Scenario 1: Escalation and Entrenchment
In this darker timeline, Trump pursues even more aggressive tariffs as trade deficits fail to narrow and manufacturing gains disappoint. China refuses to make substantive concessions, leading to a permanent decoupling of the world’s two largest economies. European patience exhausts, triggering comprehensive countermeasures. The effective tariff rate climbs above 20%, and retaliatory measures multiply.
This scenario risks stagflation—the toxic combination of weak growth and elevated inflation that paralyzed policymaking in the 1970s. Consumer confidence craters as prices rise and employment softens. Business investment remains depressed. The dollar weakens significantly, raising import costs further but also increasing the burden of servicing dollar-denominated debt globally. Emerging markets face capital flight and currency crises.
Probability: 25%. This remains a tail risk rather than the central case, but political incentives—particularly Trump’s unwillingness to acknowledge policy failures—could push toward escalation if economic conditions deteriorate or if he perceives political benefit.
Scenario 2: Negotiated Resolution and Selective Rollback
The middle path sees Trump leverage tariffs as bargaining chips to extract concessions, then declare victory and pull back. Deals with Japan (already reached at 15% tariffs), the UK, and other partners provide templates. China agrees to modest reforms and increased purchases of American products in exchange for tariff reductions to 40-50% rather than current levels.
USMCA survives its 2026 review with adjustments. The EU and US strike a limited agreement on specific sectors. While tariffs don’t return to pre-2025 levels, they stabilize at a “new normal” of 8-10% effective rates—higher than the historical average but far below current peaks. Supply chains adapt, with some manufacturing returning to the US and Mexico while China’s share of imports permanently declines.
Inflation gradually subsides as supply chains stabilize and retaliatory measures ease. GDP growth recovers modestly. Financial markets stabilize, pricing in the new equilibrium. The economic costs are real but manageable—a permanent reduction in efficiency and living standards, but not a crisis.
Probability: 50%. This represents the most likely outcome, reflecting Trump’s past pattern of using tariffs for negotiation, market sensitivity constraining worst impulses, and the sheer economic pressure for resolution.
Scenario 3: Status Quo Drift and Adaptation
In this scenario, tariffs remain elevated but cease being the dominant political and economic story. Legal challenges wind through courts, with the Supreme Court potentially ruling on IEEPA authority in ways that complicate but don’t eliminate the tariff regime. Trump’s attention shifts to other priorities. Trade volumes adjust to the new cost structure, with supply chains reconfigured and companies accepting tariffs as a cost of doing business.
The economy muddles through with slightly slower growth—1.5-1.8% annually rather than 2.0-2.5%—and inflation settling at 2.5-3.0% rather than the Fed’s 2% target. Manufacturing sees modest gains in protected sectors but no dramatic reshoring. American households permanently adjust to somewhat higher prices and reduced purchasing power. Financial markets find a new normal of slightly elevated volatility around tariff-related news but without the extreme swings of spring 2025.
This scenario represents managed decline—not a catastrophe, but a slow erosion of US economic dynamism and living standards relative to what might have been.
Probability: 25%. This outcome requires both political paralysis (neither full escalation nor decisive resolution) and economic resilience (avoiding recession despite headwinds).
Indicators to Watch
Several key metrics will signal which scenario unfolds:
Manufacturing PMI: Purchasing Managers’ Index data will reveal whether protected industries are actually expanding or if input cost increases are overwhelming any benefits. Readings consistently below 50 indicate contraction and would suggest the tariff strategy is failing even on its own terms.
Core PCE Inflation: The Federal Reserve’s preferred inflation measure must trend back toward 2% for tariffs to be economically sustainable. If core PCE remains above 3% through mid-2026, pressure will mount for policy changes.
Trade Deficit Trends: Trump’s stated goal is narrowing the trade deficit. If the deficit widens despite tariffs—as economic theory suggests could happen due to dollar appreciation and reduced export competitiveness—the political logic of tariffs weakens.
Supply Chain Investment Data: Watch announcements of major manufacturing facility investments in the US. If these materialize in meaningful scale, it would validate reshoring claims. If they don’t, it indicates tariffs alone are insufficient to overcome other cost disadvantages.
Retaliatory Measure Evolution: Whether trading partners escalate, maintain, or reduce retaliatory tariffs will significantly impact outcomes. China’s decisions are particularly crucial given the scale of bilateral trade.
2026 Midterm Calculations: As congressional elections approach, political pressure from affected industries and states could force tariff modifications. Key Senate and House races in agricultural and manufacturing-heavy states will be telling.
The Real Cost of Economic Nationalism
Step back from the technical details and data points, and a broader truth emerges: We’re conducting an enormous economic experiment with American prosperity as the wager. The question isn’t whether tariffs impose costs—they demonstrably do. It’s whether the benefits—whatever form they take—justify those costs.
The Trump administration argues yes, pointing to national security concerns about supply chain vulnerability, the need to rebuild manufacturing capacity, and the injustice of unequal trading relationships. These aren’t trivial concerns. China’s dominant position in critical supply chains, from rare earth elements to pharmaceuticals, poses genuine risks. The hollowing out of American industrial capacity over decades has social and strategic costs beyond pure economics.
But economics cannot be wished away. Every dollar spent on more expensive domestic production rather than cheaper imports is a dollar not spent on something else—education, healthcare, innovation, or simply higher living standards. The $2,400 annual household tariff burden represents lost purchasing power that disproportionately affects those least able to afford it. The uncertainty tax on business investment means forgone productivity gains and innovation.
Perhaps most concerning is what this experiment reveals about governance and policy process. The chaotic, announcement-pause-modification-reversal cycle has undermined both legal norms (the unprecedented use of IEEPA for trade policy faces serious constitutional challenges) and international trust. Even if specific tariff rates eventually settle at reasonable levels, the demonstration that US trade policy can shift radically based on presidential whim makes the US a less reliable partner.
The promised manufacturing renaissance hasn’t materialized at scale. Jobs in protected industries haven’t offset losses in trade-exposed sectors and downstream users. The trade deficit, despite all the disruption, hasn’t narrowed meaningfully. And the Treasury revenue windfall, while real, comes nowhere close to offsetting income taxes as Trump has suggested, meaning it represents at best a partial offset to other tax cuts rather than a new fiscal foundation.
For business leaders, the lesson is stark: flexibility and geographic diversification matter more than ever. For investors, volatility isn’t a temporary phenomenon but a feature of the current policy environment. For policymakers contemplating similar approaches, the evidence suggests blunt tariff instruments create more collateral damage than their advocates acknowledge.
Conclusion: An Unfinished Story with High Stakes
We stand at a crossroads. The tariff regime implemented in 2025 represents either the beginning of a new American economic model—one that prioritizes security and self-sufficiency over efficiency and interdependence—or a costly detour that will ultimately be unwound as its costs become undeniable.
History suggests caution. Every major episode of trade protection, from Smoot-Hawley to 1970s protectionism, eventually gave way to liberalization as the costs mounted and the promised benefits failed to materialize. But history also shows that trade policy is intensely political, and once constituencies form around protection, dismantling it proves difficult.
The $250 billion collected in tariffs this year is real money. The thousands of jobs lost in agriculture, freight, and manufacturing are real losses. The $2,400 hitting household budgets is real pain. The volatility whipsawing markets is real uncertainty. All of it adds up to an economy operating below its potential, with families bearing costs that outweigh any benefits to protected industries.
As we enter 2026, the question isn’t whether tariffs will dominate economic policy discussions—they will. It’s whether evidence will matter more than ideology, whether pragmatism will overcome populism, and whether the American economy’s remarkable resilience can overcome self-imposed barriers.
The experiment continues. The data is mounting. And the stakes—for American workers, consumers, businesses, and global leadership—have never been higher.
For investors, businesses, and households, the message is clear: In an era of tariff uncertainty, adaptability isn’t optional—it’s survival. For policymakers, the evidence demands honest assessment. Are we building a more resilient economy, or simply a more expensive one?
The answer will define American prosperity for a generation.
The Author is an award-winning political economy columnist specializing in trade policy, fiscal economics, Foreign Policy ,Security and international commerce. Previously covered tariff impacts during multiple administrations for major financial publications.
Data Sources: Congressional Research Service, US Customs and Border Protection, Tax Foundation, Peterson Institute for International Economics, Penn Wharton Budget Model, JP Morgan Global Research, Yale Budget Lab, Federal Reserve Economic Data, Harvard Business School Pricing Lab, Atlantic Council, International Trade Centre


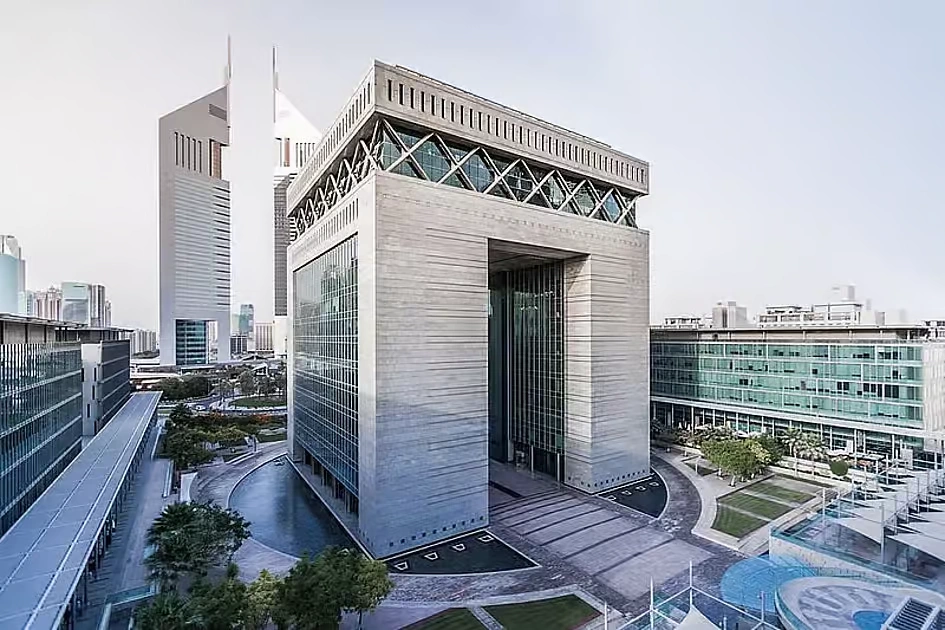
Dubai has climbed to its highest position ever on one of finance’s most closely watched rankings, and the achievement is no accident — it is the direct output of a decade-long, numerically explicit government strategy that few other financial centres have attempted to execute with this level of precision.
The Ranking Itself
The Dubai International Financial Centre has recorded its highest-ever position on the Global Financial Centres Index at seventh place worldwide, the highest ranking ever achieved by any financial centre across the Middle East, Africa and South Asia region, and the only MEASA-region centre to feature in the global top 20 — underscoring both its regional dominance and genuine global competitiveness.
The D33 Strategy Behind the Number
The ranking is explicitly tied to Dubai’s own stated ambitions. The GFCI result is described as pivotal to Dubai’s goal of becoming one of the world’s top four financial centres by 2033, in line with the Dubai Economic Agenda, or D33, which targets a doubling of the emirate’s economy over the decade. Separately, Dubai Chambers has confirmed the plan targets cumulative economic output of AED 32 trillion, or roughly $8.7 trillion, over the decade, supported by 100 transformative projects centred on trade expansion, digital innovation and sustainable growth.
The Underlying Economic Engine
The financial-centre ambitions are backed by genuine current-quarter growth. Dubai’s economy reached AED 232 billion in first-quarter 2026 GDP, a 2.4 percent year-on-year increase, with the finance, construction, healthcare, wholesale and retail trade, and real estate sectors all contributing to the broad-based expansion. Middle East Briefing separately projects the wider UAE economy will expand around 5 percent in 2026, with local banks positioned to increase lending both domestically — supporting SMEs, consumers and project finance — and across borders into markets like Saudi Arabia, where UAE banks’ comparatively lower interbank rates create an arbitrage opportunity.
Real Money Behind the Ranking
The GFCI climb is being validated by tangible transaction volume rather than sentiment alone. Weekly UAE business tracking shows a steady drumbeat of institutional activity: Sharjah Islamic Bank reported AED 803.9 million in net profit, up 15.3 percent, ADI Chain secured a $50 million investment to build sovereign digital infrastructure, and Capital.com reported $1.1 trillion in second-quarter trading volume routed through the jurisdiction. Separately, UAE and Saudi banks are projected to lead GCC credit growth in 2026, reinforcing Dubai and Abu Dhabi’s combined position as the region’s default financial gateway.
Why This Matters for Pakistan and South Asia
Dubai’s ascent as a financial hub carries direct relevance for Pakistan, where — as detailed in our companion coverage of Pakistan’s remittance exposure — roughly 55 percent of the country’s substantial remittance inflows originate from the Gulf Cooperation Council. A deepening, increasingly sophisticated DIFC-anchored financial ecosystem in Dubai means more efficient, lower-cost channels for that capital, alongside growing opportunities for Pakistani and South Asian firms to access GCC-sourced project finance and cross-border credit as UAE banks expand lending beyond their domestic market.
What is Dubai’s global financial centre ranking in 2026?
Dubai’s DIFC recorded its highest-ever ranking on the Global Financial Centres Index at 7th place worldwide in 2026 — the highest ever achieved by any Middle East, Africa or South Asia financial centre — as part of its stated goal to become a top-four global financial hub by 2033.
The Risk Beneath the Growth Story
Not every signal points to unambiguous strength. AGBI’s own reporting notes that UAE banks’ second-quarter results are likely to show weaker profits, slower lending and narrower margins, even as analysts characterise the underlying sector as fundamentally resilient — a reminder that Dubai’s financial-hub ambitions are being pursued against a genuinely more difficult regional operating environment shaped by the Strait of Hormuz disruption and broader Gulf security concerns, not in isolation from them.
The Bottom Line
Dubai’s climb to seventh in the GFCI rankings is less a one-off achievement than a measurable checkpoint on an explicitly numbered, decade-long strategic roadmap — one increasingly backed by real GDP growth, credit expansion, and institutional trading volume rather than ambition alone.
Analysis
Global Central Bank Divergence 2026: Why the Fed, BoE, BoJ, and PBoC Are All Moving Differently
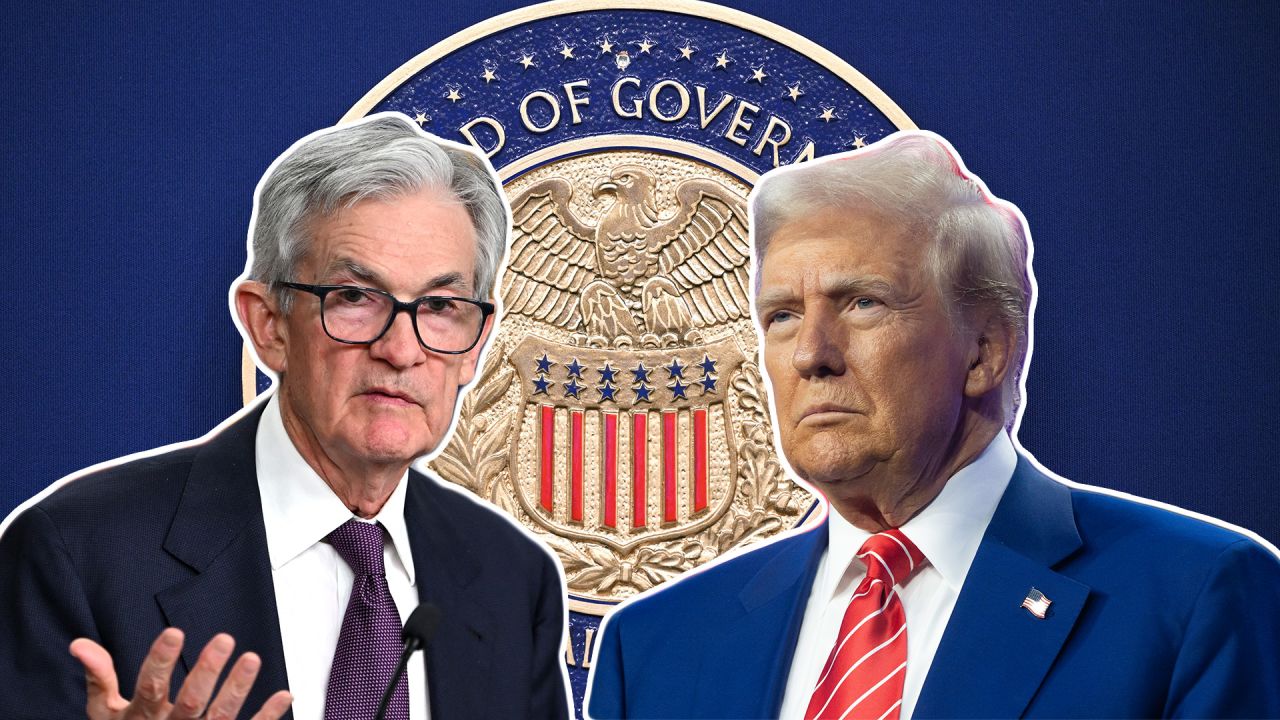
The world’s major central banks are no longer moving in anything resembling lockstep. The Federal Reserve is watching a weakening labor market while weighing energy-driven inflation risk, the Bank of Japan is scaling back bond purchases into a fiscal expansion, the Bank of Russia is cutting rates through sanctions-driven stagnation, and the Bank of England is openly discussing a hike rather than the cuts it signaled just months ago, a divergence in global monetary policy that reflects how unevenly the Iran war’s economic shock has landed across different economies.
The Fed’s Data-Dependent Pivot
Federal Reserve Chairman Kevin Warsh has explicitly asked markets to look to incoming data rather than central bank guidance to map the path for US interest rates, a communication shift that took on new significance after June’s jobs report showed just 57,000 new positions, roughly half the expected pace, according to Yahoo Finance’s markets coverage. Warsh has separately said inflation risks have eased substantially, a combination that has markets betting on a more accommodative Fed even as the central bank has offered no formal commitment ahead of its July 30 decision.
The Bank of England’s Reversal
Few central banks illustrate the scale of the pivot as clearly as the Bank of England. Governor Andrew Bailey said market pricing for two rate cuts this year had looked reasonable before the Iran war lifted inflation risks, according to the Credit Protection Association’s reporting, a statement that effectively closed the door on the easing path the Bank had signaled entering 2026. With UK inflation forecast to climb back toward 3.5% by year end and the base rate held at 3.75%, RSM UK’s analysis suggests a hike, not a cut, is now the more live possibility for the Bank’s July 30 decision, timed to land the same day as the Fed’s own announcement.
Canada and the Bank of Canada’s Cautious Hold
The Bank of Canada has held its policy rate at 2.25% since the spring, balancing a genuinely fragile domestic economy, technically in recession by some measures, against the same energy-driven inflation pressure affecting the UK, according to the central bank’s own announcement. Unlike the Fed or Bank of England, the Bank of Canada’s dilemma is compounded by an unresolved CUSMA trade review, meaning its policy path depends as much on trade negotiation outcomes as on conventional inflation and employment data.
Russia’s Disinflation Campaign, Slowed but Not Abandoned
At the opposite extreme sits the Bank of Russia, which has cut its key rate eight consecutive times since June 2025, from a record 21% down to 14.25% by its June 2026 decision, even as annual inflation remains at 5.6%, well above its 4% target, according to the central bank’s own data. Governor Elvira Nabiullina’s cutting cycle reflects a fundamentally different set of pressures than Western central banks face: a wartime economy where fiscal policy, not conventional demand, drives the inflation picture, and where the central bank’s June cut of just 25 basis points, smaller than the market’s expected 50, signals genuine caution about cutting too fast into persistent pro-inflationary risk from higher domestic energy costs.
Asia’s Split Response
Indonesia and Malaysia illustrate how differently emerging Asian economies are navigating the same global energy shock. Bank Indonesia has held its rate at 4.75% for seven consecutive meetings specifically to defend the rupiah, which has weakened 3.6% year-to-date, according to McKinsey’s regional review, prioritizing currency stability over the growth-supportive easing its 5.61% GDP growth might otherwise justify. Bank Negara Malaysia, by contrast, has benefited from a currency that has held relatively firm, giving it more flexibility, though inflation drifting toward the top of its 1.5% to 2.5% target range, per The Edge Malaysia’s reporting, suggests that flexibility may narrow through the second half of the year.
Japan sits furthest from the rest of the pack. The Bank of Japan has been reducing its own bond purchases even as 10-year Japanese government bond yields have climbed above 2.75%, their highest level since May 2026, according to Trading Economics, a tightening-adjacent move driven as much by concern over Prime Minister Sanae Takaichi’s fiscal expansion plans as by conventional inflation targeting.
China’s Different Problem Entirely
China’s central bank faces a problem none of its peers share: six consecutive quarters of deflation rather than inflation. Societe Generale economist Wei Yao has suggested Chinese bond yields could fall to record lows in 2026 as the People’s Bank of China continues easing, a view consistent with Beijing’s own base case of roughly RMB 1 trillion in additional fiscal stimulus alongside 20 basis points of rate cuts and 50 basis points of reserve requirement ratio cuts, according to Citi Research’s 2026 outlook, cited via Asia Times’ coverage of the Politburo’s domestic demand pivot.
What This Divergence Actually Means
The practical consequence of seven major central banks pursuing seven distinct policy paths is a global capital markets environment where currency volatility, carry trade dynamics, and cross-border capital flows have become considerably harder to forecast using any single macro framework. When Japan’s ultra-low yields anchored global borrowing costs and most Western central banks moved in broad cyclical alignment, currency and rate forecasting rested on relatively stable assumptions about global monetary conditions. That anchor is now gone. Investors positioning across UK gilts, US Treasurys, Japanese government bonds, and emerging Asian debt in the second half of 2026 face a genuinely fragmented policy landscape, one where the same global shock, the Iran war’s energy price spike, has produced hikes, holds, and cuts in near-equal measure depending entirely on each economy’s starting fiscal position, currency exposure, and domestic political constraints.
Rich Nations Face Make‑or‑Break Moment at COP31 Preparatory Talks
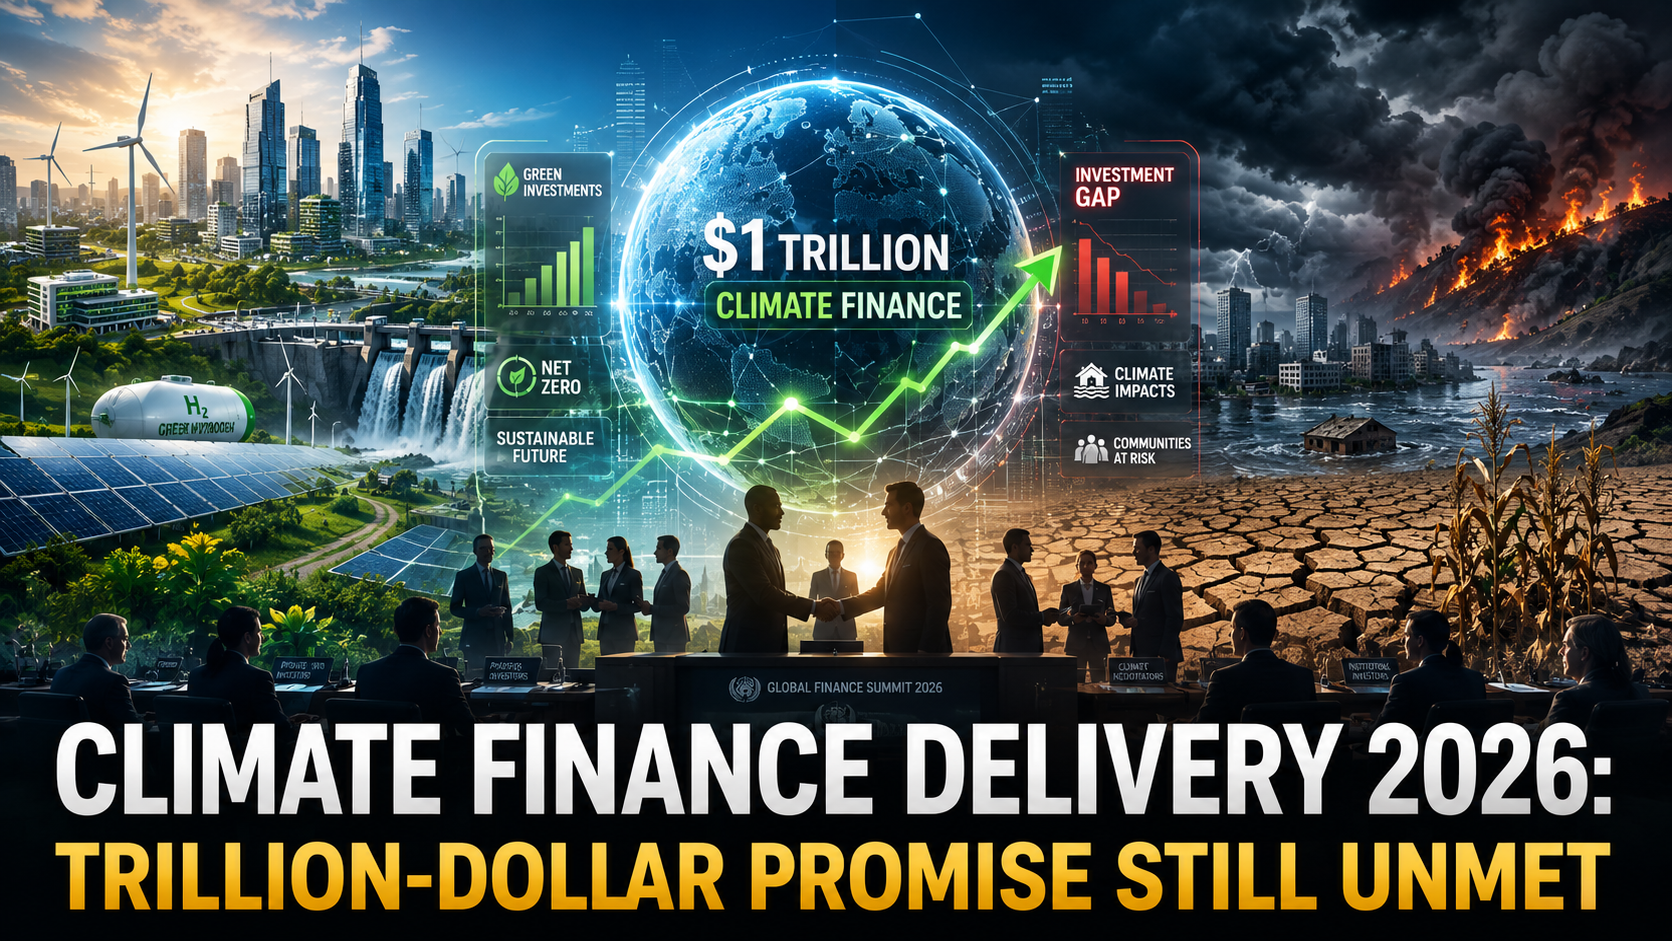
The United Nations Framework Convention on Climate Change (UNFCCC) has released a sobering assessment: climate finance delivery 2026 remains a staggering $1.1 trillion short of the $2.4 trillion that developing countries need annually to transition to low‑carbon economies and adapt to climate impacts (UNFCCC Standing Committee on Finance, June 2026). The report, published ahead of the pre‑COP31 ministerial in Bonn, reveals that total climate finance flows reached $1.3 trillion in 2024 (the latest available data), virtually flat from 2023. While the number is a record in absolute terms, the chasm between what is provided and what is needed is widening, not narrowing.
The Structure of the Shortfall
The $2.4 trillion annual need is broken down into three components: $1.2 trillion for mitigation (clean energy, industry decarbonisation), $800 billion for adaptation (sea walls, drought‑resilient crops, early warning systems), and $400 billion for loss and damage (compensation for unavoidable climate impacts). Currently, mitigation receives the lion’s share of finance—over 85%—mostly in the form of loans that add to debt burdens. Adaptation, which is most critical for the poorest countries, receives only $130 billion, and loss and damage, despite the operationalisation of a dedicated fund at COP28 in 2023, has seen a mere $2 billion in pledges against the $400 billion ask.
The loss and damage fund, a hard‑won victory for vulnerable nations, is emblematic of the gap between rhetoric and reality. Rich countries have committed just 0.5% of what the UNFCCC secretariat estimates is required for countries like Pakistan (2022 floods), Vanuatu (cyclones), and the Sahel (desertification) to rebuild in a climate‑resilient manner. The World Bank, which hosts the fund, has been slow to disburse, and the US, historically the largest historical emitter, has contributed only $500 million, a fraction of its fair share (World Bank Loss and Damage Fund Update, June 2026).
The NCQG Negotiations: Who Pays?
The NCQG negotiations (new collective quantified goal on climate finance) are the central battlefield of COP31, scheduled for November 2026 in Brasília. The current goal, set at COP15 in 2009, was $100 billion a year by 2020—a target met only in 2022. The new goal must reflect the drastically increased needs and a broader donor base. The EU and the US are insisting that China, now the world’s largest emitter and the second‑largest economy, must become a formal contributor, arguing that the 1992 division of the world into “Annex I” (developed) and “non‑Annex I” (developing) is outdated. China and the G77+China grouping counter that historical responsibility and per‑capita emissions still place the primary obligation on the old industrial powers.
The deadlock has been partially broken by a bridging proposal from the COP31 presidency (Brazil) that would create a three‑tiered system: Tier 1 contributors (traditional donors) would provide grants and concessional finance; Tier 2 contributors (high‑income developing countries like China, Saudi Arabia, Singapore) would provide non‑concessional loans and technology transfer; and Tier 3 contributors (multilateral development banks) would leverage their balance sheets to mobilise private capital. The proposal would set a cumulative target of $1.5 trillion a year by 2030, but the tiers’ shares remain hotly contested (UNFCCC, Pre‑COP31 Ministerial Draft Text, June 2026).
Mobilising Private Finance: The MDB Reform Agenda
Given the fiscal constraints in donor countries, the real engine of increased climate finance must be the multilateral development banks (MDBs) and the private sector. The World Bank, under its new president, has implemented the recommendations of the G20 Capital Adequacy Framework review, which could unlock an additional $100 billion in lending headroom over a decade without requiring new capital. The Bank is launching a new “Climate Enhanced” bond, where coupon payments are linked to verified emission reduction outcomes in a portfolio of African clean‑cooking and reforestation projects, targeting institutional investors hungry for impact‑linked returns (World Bank, Outcome Bond Issuance, June 2026).
The International Finance Corporation is expanding its “Green Up” guarantee facility, which de‑risks private investments in emerging‑market renewable energy by covering first‑loss risks. The Glasgow Financial Alliance for Net Zero (GFANZ) has evolved from a coalition of pledges to a set of country‑specific investment platforms: in Vietnam, a Just Energy Transition Partnership has mobilized $15 billion, and in Senegal, a similar platform is targeting $5 billion for solar and green hydrogen. These vehicles blend public concessional capital with private investment, but scaling them to the $2.4 trillion level remains aspirational.
The Cost of Inaction
The UNFCCC report emphasizes that every year of underfunding magnifies the eventual bill. The cost of inaction—measured in destroyed infrastructure, lost crop yields, and health crises—is accelerating. Swiss Re estimates that unabated climate change could reduce global GDP by 11% by 2050 (Swiss Re Institute, “Climate Economics”, 2026). For the private sector, climate risk is already material: supply chains are being disrupted by floods in Bangladesh and droughts in Panama, and insurance coverage is retreating from vulnerable regions, leaving assets stranded. The business case for closing the climate finance gap is not charitable; it is self‑interest.
The pre‑COP31 talks in Bonn are being described by veteran negotiators as the most consequential since Copenhagen 2009. The outcome will determine whether the Paris Agreement’s 1.5°C target remains within reach. The message from the UNFCCC is unambiguous: the world’s financial architecture is not fit for purpose in the face of a climate emergency, and the window for reform is closing fast.

Pakistan’s Remittance Lifeline: Why Gulf Exposure Is a Hidden Risk

Dubai’s Rise to the World’s 7th Financial Hub: Inside the D33 Push

China EV Exports Hit Record High in 2026

UK’s “National Contributions Tax” Explained: Burnham-Era Reform 2026

Russia’s Strange Problem in 2026: Its Currency Is Too Strong

Section 301 Forced Labor Tariffs 2026: 60 Countries Affected

UK National Contributions Tax: Burnham’s Radical Tax Plan

Global Central Bank Divergence 2026: Why the Fed, BoE, BoJ, and PBoC Are All Moving Differently

Japan’s Bond Market Just Cracked. It Could Take the Rest of the World’s Debt With It

Malaysia’s Ringgit Is Holding Up. Economists Say the Real Test Is Still Coming

Climate Finance Delivery 2026: Trillion‑Dollar Promise Still Unmet

AI Impact on Wages 2026: Productivity Soars, Paychecks Stagnate

SpaceX IPO 2026: $2 Trillion AI Bubble, OpenAI & Anthropic — What Investors Must Know

China Economy 2026: Property Crisis, AI Investment & Export Surplus Explained

Top 15 Stocks for Investment in 2026 in PSX: Your Complete Guide to Pakistan’s Best Investment Opportunities
Top 15 Stocks for Investment in 2026 in PSX: Your Complete Guide to Pakistan’s Best Investment Opportunities

Debunking IMF Program Myths: Reconfiguring Engagement for True National Ownership in a Volatile World

Top 10 Mutual Fund Managers in Pakistan for Investment in 2026: A Comprehensive Guide for Optimal Returns

What the U.S. Attack on Venezuela Could Mean for Oil and Canadian Crude Exports: The Economic Impact

China’s 50% Domestic Equipment Rule: The Semiconductor Mandate Reshaping Global Tech

15 Most Lucrative Sectors for Investment in Pakistan: A 2025 Data-Driven Analysis

Pakistan’s Export Goldmine: 10 Game-Changing Markets Where Pakistani Businesses Are Winning Big in 2025
15 Most Lucrative Sectors for Investment in Pakistan: A 2025 Data-Driven Analysis
15 Most Lucrative Sectors for Investment in Pakistan: A 2025 Data-Driven Analysis

Pakistan’s Economic Outlook 2025: Between Stabilization and the Shadow of Stagnation
Pakistan’s Economic Outlook 2025: Between Stabilization and the Shadow of Stagnation

China’s Property Woes Could Last Until 2030—Despite Beijing’s Best Censorship Efforts
China’s Property Woes Could Last Until 2030—Despite Beijing’s Best Censorship Efforts
-
 Markets & Finance7 months ago
Top 15 Stocks for Investment in 2026 in PSX: Your Complete Guide to Pakistan’s Best Investment Opportunities
-
Markets & Finance7 months ago
Top 15 Stocks for Investment in 2026 in PSX: Your Complete Guide to Pakistan’s Best Investment Opportunities
-
 Analysis6 months ago
Debunking IMF Program Myths: Reconfiguring Engagement for True National Ownership in a Volatile World
-
 Investment6 months ago
Top 10 Mutual Fund Managers in Pakistan for Investment in 2026: A Comprehensive Guide for Optimal Returns
-
 Global Economy7 months ago
What the U.S. Attack on Venezuela Could Mean for Oil and Canadian Crude Exports: The Economic Impact
-
 Asia7 months ago
China’s 50% Domestic Equipment Rule: The Semiconductor Mandate Reshaping Global Tech
-
 AI7 months ago
15 Most Lucrative Sectors for Investment in Pakistan: A 2025 Data-Driven Analysis
-
 Exports7 months ago
Pakistan’s Export Goldmine: 10 Game-Changing Markets Where Pakistani Businesses Are Winning Big in 2025