
Oil Crisis
The US$100 Barrel: Oil Shockwaves Hit South-east Asia — And Could Surge to $150


Oil shock Southeast Asia | Strait of Hormuz disruption | Stagflation risk Philippines Thailand | Fuel subsidy bills Asia 2026
Picture a Monday morning in Bangkok’s Chatuchak district. Nattapong, a 34-year-old motorcycle-taxi driver who normally hauls commuters through gridlocked sois for roughly 400 baht a day, is staring at a petrol pump display that has climbed the equivalent of 18% in eight days. He hasn’t raised his fares yet — the app won’t let him — but his margins have almost evaporated. “Before, I could fill up and still send money home,” he says quietly. “Now I’m not sure.”
Multiply Nattapong’s dilemma across 700 million people, eleven countries, and a dozen interconnected supply chains, and you begin to understand what the Strait of Hormuz crisis of March 2026 is doing to South-east Asia. On the morning of Monday, March 9, 2026, Brent crude futures spiked as high as $119.50 a barrel — a session high that will be branded into the memory of every finance minister from Manila to Jakarta — before settling around $110.56, still up nearly 40% in a single month. WTI posted its largest weekly gain in the entire history of the futures contract, a staggering 35.6%, a record stretching back to 1983.
The trigger: joint US-Israeli strikes on Iran beginning February 28, which escalated into a full war and brought Strait of Hormuz shipping to a near-total halt. The choke point — that narrow 33-kilometre-wide passage between Oman and Iran — carries roughly 20 million barrels of oil per day, about one-fifth of global supply. When Iran’s Revolutionary Guard declared the waterway effectively closed and warned vessels they would be targeted, the arithmetic was brutal and immediate. Iraq and Kuwait began cutting output after running out of storage. Qatar’s energy minister told the Financial Times that crude could reach $150 per barrel if tankers remain unable to transit the strait in coming weeks. At Kpler, lead crude analyst Homayoun Falakshahi was blunter: “If between now and end of March you don’t have an amelioration of traffic around the strait, we could go to $150 a barrel,” he told CNN.
For South-east Asia — a region that imports the overwhelming majority of its oil and whose economies run on cheap fuel the way a clock runs on a mainspring — this is not merely a commodity story. It is a cost-of-living crisis, a monetary policy dilemma, and a fiscal time bomb, all detonating simultaneously.
Oil Shock Southeast Asia: Why the Region Is Uniquely Exposed
The geography alone is damning. Japan and the Philippines source roughly 90% of their crude from the Persian Gulf; China and India import 38% and 46% of their oil from the region, respectively. South-east Asia as a whole, with the sole exception of Malaysia, runs a persistent deficit in oil and gas trade. When the Strait of Hormuz tightens, the region doesn’t just pay more — it scrambles for supply.
MUFG Research calculates that every US$10 per barrel increase in oil prices worsens the current account position of Asian economies by 0.2–0.9% of GDP, with Thailand, Singapore, Taiwan, India, and the Philippines taking the largest hits. From a starting price of roughly $60 per barrel in January 2026 to a current print north of $110, that’s a $50-per-barrel shock — implying current account deterioration of potentially 1–4.5% of GDP for the region’s most vulnerable economies. Run that number through to your household electricity bill, your bag of jasmine rice, your morning commute, and the pain becomes visceral.
Nomura’s research team, in a note that has become one of the most-cited documents in Asian trading rooms this week, identified Thailand, India, South Korea, and the Philippines as the most vulnerable economies in Asia. The bank’s reasoning is unforgiving: Thailand carries the largest net oil import bill in Asia at 4.7% of GDP, meaning every 10% oil price change worsens its current account by 0.5 percentage points. The Philippines runs a current account deficit that, at oil above $90 per barrel on a sustained basis, is likely to breach 4.5% of GDP. “In Asia, Thailand, India, Korea, and the Philippines are the most vulnerable to higher oil prices, due to their high import dependence,” Nomura wrote, “while Malaysia would be a relative beneficiary as an energy exporter.”
Country by Country: Winners, Losers, and the Ones Caught in the Middle
The Philippines: Worst in Class, No Cushion
If there is one country in the region for which this crisis reads like a worst-case scenario, it is the Philippines. Manila has nearly 90% of its oil imports sourced from the Middle East and, crucially, operates a largely market-driven fuel pricing mechanism with minimal subsidies. There is no state buffer absorbing the shock before it hits the pump. Retailers in Manila imposed over ₱1-per-liter increases for the tenth consecutive week as of early March, covering diesel, kerosene, and gasoline. The Philippine peso slid back through the ₱58-per-dollar mark on March 9, adding a currency depreciation multiplier to an already brutal import bill.
ING Group estimates the Philippines could see inflation rise by up to 0.4 percentage points for every 10% increase in oil prices. At Nomura, the estimate is 0.5pp per 10% rise — the highest pass-through in the region. Oil at $110 represents roughly an 80% increase over January’s $60 baseline, an inflationary impulse that Capital Economics pegs could push headline CPI well above the Bangko Sentral ng Pilipinas’s 2–4% target. Manila has already announced plans to build a diesel stockpile as an emergency buffer — an admission that supply anxiety, not just price, has entered the conversation.
Thailand: The Biggest Structural Loser
Thailand’s problem isn’t just the size of its oil import bill — it’s the timing. The country is already wrestling with below-potential growth, persistent deflationary pressures in some sectors, and a tourism sector still finding its post-COVID footing. MUFG Research flags Thailand as one of the economies most sensitive to oil price increases from an inflation perspective, with CPI rising up to 0.8 percentage points per US$10/bbl increase — the highest reading in their Asian sensitivity matrix.
The government responded swiftly, announcing a suspension of petroleum exports to protect domestic stocks, an extraordinary measure that signals just how seriously Bangkok is treating supply security. The Thai baht, already vulnerable, has come under selling pressure alongside the Philippine peso, Korean won, and Indian rupee. For Thai factory workers supplying export goods to Western markets, higher transport and energy costs arrive precisely when global demand is wobbling under the weight of US tariffs. It is, as the textbook definition goes, a stagflationary shock — cost pressures rising while growth falters.
Indonesia: The Fiscal Tightrope
Indonesia occupies a peculiar position. It is technically a net importer of petroleum products — paradoxical for a country that was once an OPEC member — but it deploys a system of fuel subsidies (via state-owned Pertamina) that partially shields consumers from global price moves. The catch, of course, is that the shield is funded by the national treasury.
Indonesia’s government budget was built around an Indonesian Crude Price (ICP) assumption of $70 per barrel for 2026. With Brent at $110, that assumption looks almost quaint. Government simulations, according to Indonesia’s fiscal authority, show the state budget deficit could widen to 3.6% of GDP if crude averages $92 per barrel over the year — already above the 3% legal ceiling. At $110 sustained, the numbers are worse. Officials have acknowledged that raising domestic fuel prices — essentially passing the shock to consumers — could become a last resort. Nomura estimates a 10% oil price rise could worsen Indonesia’s fiscal balance by 0.2 percentage points via higher subsidy spending, breaching the 3% deficit ceiling at sufficiently elevated prices. President Prabowo Subianto, who swept to power partly on a cost-of-living platform, faces a politically combustible choice between fiscal discipline and popular anger at the pump.
Malaysia: The Region’s Unlikely Winner
Not everyone in South-east Asia is suffering equally. Malaysia, a net oil and gas exporter and home to Petronas — one of Asia’s most profitable energy companies — finds itself on the rare right side of an oil shock. MUFG Research identifies Malaysia as the only net oil and gas exporter in the region, likely to see a small benefit to its trade balance from higher prices. The ringgit, which has been strengthening as a commodity-linked currency, provides a further buffer.
The complexity lies in Malaysia’s domestic subsidy architecture. Kuala Lumpur has been in the process of a painstaking, politically fraught RON95 fuel subsidy reform — targeting the top income tiers first — which was already reshaping the fiscal landscape before the current crisis. Higher global prices actually make the reform argument easier: the subsidy bill would explode if oil stays elevated, giving Prime Minister Anwar Ibrahim political cover to accelerate rationalization. For Malaysia’s treasury, $110 oil is a revenue windfall and a subsidy headache simultaneously.
Singapore: The Price-Setter That Cannot Escape
Singapore imports everything, including every drop of fuel, but its role as a regional refining and trading hub makes it a price-setter rather than merely a price-taker. The city-state’s commuters are already feeling it: transport costs have risen sharply, and the government’s careful cost-of-living management is under renewed pressure. MUFG’s analysis ranks Singapore among the economies with the highest current account sensitivity to oil price increases, even though its GDP per capita provides a far larger fiscal cushion than its regional neighbours.
Stagflation Risk: The Word Nobody Wanted to Hear
The word “stagflation” is being whispered — and in some trading rooms, shouted — across Asia this week. Nomura’s note explicitly warns of a “stagflationary shock”: the simultaneous combination of rising inflation (from fuel and food cost pass-through) and slowing growth (from weakening consumer purchasing power and export competitiveness). It is the worst of both monetary worlds, leaving central banks without a clean tool. Cut rates to support growth, and you risk stoking inflation. Hold rates to fight inflation, and you choke a slowing economy.
ING Group notes the impact is far from uniform, with several economies partially shielded by subsidies or regulated pricing — but for the Philippines, the stronger inflation hit from market-driven fuel prices creates direct pressure on the BSP to hold rates. Capital Economics, while not abandoning its rate-cut forecasts for the Philippines and Thailand, has flagged that central banks may pause if oil hits and holds above $100 — as it already has. The ripple effects move quickly: higher fuel costs push up food prices (fertilisers, transport, cold chains), which push up core inflation, which pushes up wage demands, which erode manufacturer competitiveness. The chain is well-known. The speed this time is not.
Travel and Tourism: The Invisible Casualty
The oil shock has an airborne dimension that tends to get buried beneath the more immediate news of pump prices and fiscal deficits. Jet fuel — which tracks closely with crude — has surged in lockstep with Brent. Airlines operating regional routes out of Singapore’s Changi, Bangkok’s Suvarnabhumi, and Manila’s NAIA are facing fuel costs that represent 25–35% of operating expenses at normal prices. At current Brent levels, that share rises materially. The consequences are already filtering through: several Gulf carriers have partially resumed flights from Dubai International Airport after earlier disruptions, but route uncertainty and insurance premiums for Gulf overflight remain elevated.
For South-east Asia’s tourism recovery — Bali, Chiang Mai, Phuket, and Palawan were all expecting strong 2026 visitor numbers after several lean post-pandemic years — the arithmetic is uncomfortable. Higher jet fuel costs translate, with a lag of weeks rather than months, into higher airfares. Budget carriers such as AirAsia and Cebu Pacific, which built their business models around cheap fuel enabling cheap tickets, have the least pricing power and the thinnest margins. The traveller contemplating a Bangkok city break or a Bali retreat in Q2 2026 may find the price tag has quietly risen 10–20% since they first searched. That is not a crisis. But it is a headwind — and a reminder that in a globalised economy, no leisure industry is fully insulated from a Persian Gulf conflict.
Could Oil Really Hit $150? The Scenarios
The $150 question is no longer a fringe analyst talking point. Qatar’s energy minister said it publicly. Kpler’s lead crude analyst said it on record. Goldman Sachs wrote to clients that prices are likely to exceed $100 next week if no resolution emerges — a forecast already overtaken by events.
Three scenarios shape the trajectory:
Scenario 1 — Rapid de-escalation (30 days). The US brokers a ceasefire, Hormuz reopens to traffic with naval escorts, and oil retraces toward $80–85. This is the “fast war, fast recovery” template. The damage to South-east Asia is real but contained — a quarter or two of elevated inflation, some current account deterioration, minor growth drag.
Scenario 2 — Prolonged blockade (60–90 days). Tanker insurance remains unavailable or prohibitively expensive, shipping companies stay out, and the physical supply disruption persists. JPMorgan’s Natasha Kaneva has modelled production cuts approaching 6 million barrels per day under this scenario. Brent in the $120–130 range becomes the base case. For South-east Asia, this means inflation breaching targets in the Philippines and Thailand, subsidy bills in Indonesia threatening fiscal rules, and a genuine monetary policy bind across the region.
Scenario 3 — Escalation with infrastructure damage. Further strikes on Gulf energy facilities — as already seen against Iranian oil infrastructure and Qatari and Saudi installations — reduce physical capacity for months, not weeks. $150 becomes plausible. The 1970s-style shock, feared but never fully materialised in the 2022 Ukraine episode, arrives in earnest. South-east Asian growth forecasts get ripped up. The IMF’s 2026 regional outlook, cautiously optimistic as recently as January, would require emergency revision.
The G7 finance ministers were meeting Monday to discuss coordinated strategic reserve releases; the Trump administration announced a $20 billion tanker insurance programme, though shipping companies remain hesitant to transit the region. These measures can dampen prices at the margin. They cannot substitute for an open strait.
Policy Responses and the Green Energy Accelerant
Governments across the region are not waiting passively. Thailand’s petroleum export suspension, Manila’s emergency diesel stockpiling, Indonesia’s scenario planning for domestic fuel price adjustments — these are the short-term reflexes of policymakers who have been through oil shocks before and know that the first 72 hours matter.
The more interesting question is whether this crisis, like previous energy shocks, accelerates structural energy transition. Malaysia’s Petronas has been expanding LNG capacity and renewable partnerships. Indonesia’s vast geothermal resources — the world’s second-largest — have long been under-utilised relative to their potential. The Philippines, which currently imports nearly all its energy, has been pushing solar and wind development under the Clean Energy Act framework. The calculus that kept governments cautious about rapid transition — cheap imported fossil fuels were easy and politically manageable — has just shifted violently.
As ING’s analysis notes, energy makes up a large share of consumer inflation baskets across emerging Asia, meaning the political pain of oil shocks is both immediate and democratically legible. Leaders who endure it once tend to invest in insulation against the next one. The 1973 oil shock gave Japan its world-class energy efficiency. The 2022 Ukraine crisis gave Europe its renewable acceleration. Whether 2026’s Hormuz crisis becomes South-east Asia’s inflection point toward genuine energy security remains the region’s most consequential open question.
The Bottom Line
Brent at $110 and rising is not a number — it is a sentence, handed down to 700 million people who had little say in the conflict that produced it. For the Philippines, it means inflation at the upper edge of tolerance and monetary policy frozen in place when the economy needs easing. For Thailand, it is a stagflationary pressure on a growth story that was already fragile. For Indonesia, it is a fiscal arithmetic problem that risks breaching the legal deficit ceiling. For Malaysia, it is a windfall tempered by subsidy obligations and political exposure. For Singapore, it is a cost-management challenge that tests the city-state’s well-earned reputation for economic resilience.
The $150 scenario is not inevitable. But it is no longer implausible. And in a region that runs on imported energy, the difference between $110 and $150 is not merely financial. It is the cost of a week’s groceries for a Manila family. It is whether a Thai factory orders its next shift. It is whether Nattapong, Bangkok’s motorcycle-taxi driver, can still afford to fill his tank and send money home.
That is the oil shock South-east Asia is living through, right now, in real time.


Oil Markets
Strait of Hormuz Crisis: What the Latest Tanker Attacks Mean for Oil, Shipping and Global Trade
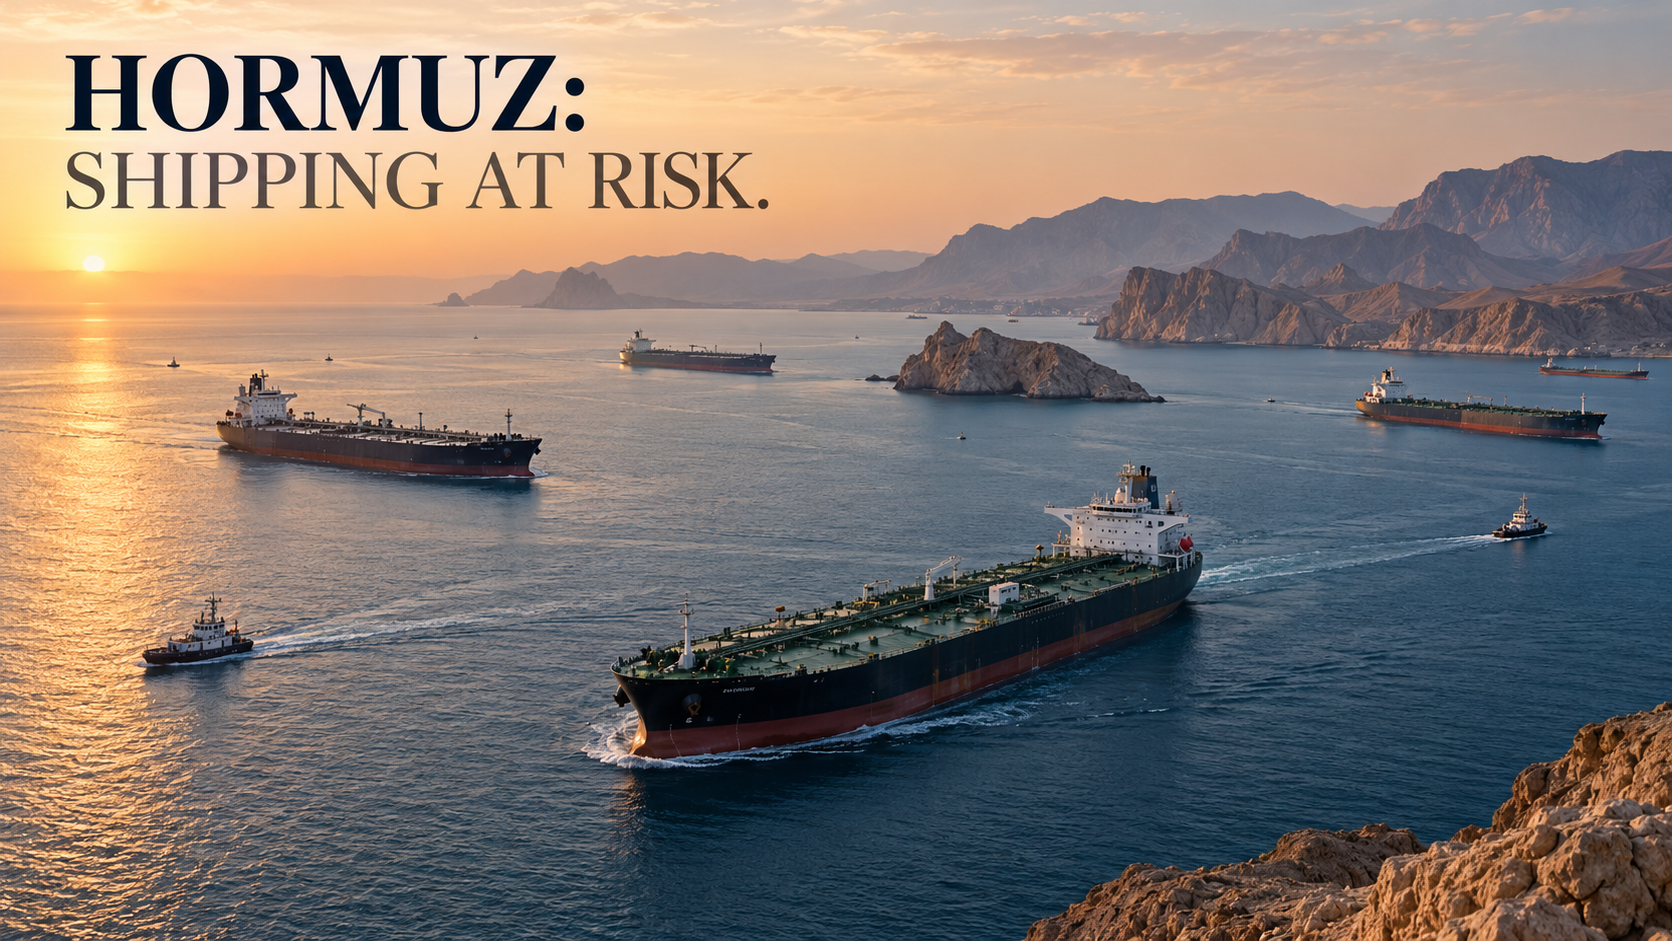
Shipping through the Strait of Hormuz, the narrow passage linking the Persian Gulf with the Gulf of Oman, remains dangerously disrupted after a renewed sequence of attacks on commercial tankers. Data reported by Reuters on October 8 showed commodity-vessel transits falling to their lowest point in more than two months, even as portions of the oil-export system had adapted to months of conflict. The immediate implications extend beyond crude prices: shipping insurance, the security of crews, refined fuels and supply chains all face pressure. Reuters’ October 8 shipping report and Lloyd’s List Intelligence’s maritime assessment provide a grounded view of the disruption.
Key takeaways:
- The strait remains severely restricted for many commercial operators, but “zero shipping” would be inaccurate.
- Recent attacks have increased risk even as some exporters have developed costly workarounds.
- Vessel transits, crude shipments and refined-product deliveries are different measures; they can move in different directions.
- Shipping conditions depend on security, insurance, crew availability, terminals, vessels and routes—not just whether the waterway is physically navigable.
Is the Strait of Hormuz closed?
There is no simple yes-or-no answer. The passage is geographically open water, but military threats and commercial risk have sharply curtailed ordinary shipping. Some vessels continue to transit while others hold back, reroute or operate under exceptional arrangements. A headline declaring a complete physical closure would erase these distinctions.
In the period reviewed by Reuters, Kpler data indicated just seven commodity-vessel passages on Tuesday, October 6, followed by 10 on Wednesday, October 7. Other tracking sources used different vessel definitions and recorded slightly different counts. These figures are snapshots, not an unchanging daily average and not proof that every class of cargo stopped moving.
The conflict’s maritime effects have continued through successive phases in 2026. An earlier understanding enabled some recovery, but the latest attacks illustrate how quickly owners, insurers and captains can reassess risk.
Why Hormuz matters to the global economy
The strait is among the most consequential energy chokepoints because Gulf producers rely on it to reach buyers in Asia and elsewhere. Tanker movements affect crude oil, condensate and petroleum products; liquefied natural gas ships also use the route.
For a sense of scale, the U.S. Energy Information Administration’s 2026 chokepoint analysis estimates average oil flows through Hormuz at 21.6 million barrels per day in the fourth quarter of 2025, compared with 4.9 million barrels per day in the second quarter of 2026. These are quarterly flow estimates, not real-time October readings. They show how significant the early disruption became, but they should not be conflated with current daily transits.
| Metric | Reported observation | What it actually measures |
|---|---|---|
| Hormuz oil flows, Q4 2025 | 21.6 million barrels/day | Quarterly average of crude, condensate and products; EIA |
| Hormuz oil flows, Q2 2026 | 4.9 million barrels/day | Quarterly average following conflict disruption; EIA |
| Commodity vessels, October 6 | 7 passages | Particular-day Kpler vessel observation reported by Reuters |
| Commodity vessels, October 7 | 10 passages | Next-day snapshot, not oil volume |
This illustrates a common mistake in rapidly moving market coverage: a lower ship count does not mechanically mean oil volume declines by the same percentage. Tanker size, load levels, cargo type and alternative export routes matter.
The latest attacks and security assessment
In its October 8 report, Lloyd’s List Intelligence said at least 13 attacks on tankers or gas carriers had been recorded since September 28. The specialist service characterized commercial shipping threats as severe and described continued pressure on the export-recovery network.
The crisis is about the safety of maritime crews as much as it is about the price of oil. A vessel that can technically sail may still lack affordable insurance, an acceptable charter agreement or crew willingness to enter a high-threat area. Owners must consider security advisories, flag and sanctions exposure, the destination of the cargo and possible interruptions on the return voyage.
Financial Times reporting has described attacks extending beyond the narrow waterway, underscoring that an operator’s exposure can continue across surrounding Gulf shipping routes. This is why changing the transit route within a region does not automatically remove the risk.
Why oil flows can recover while shipping stays abnormal
Export systems adapt when normal logistics break down. Cargo can be moved overland where pipelines exist, loaded through alternative ports, consolidated into larger vessels, or transferred between ships. These arrangements can restore some export volumes without recreating pre-crisis shipping conditions.
Lloyd’s List reported 477 non-Iranian-linked transits during September 2026, its highest month since the conflict began, while also noting that workarounds remained costly and concentrated among a relatively small group of operators. That September total and the October daily count are not directly comparable: one is a full-month measure with a specific ship definition, the others are daily snapshots of commodity vessels.
A recovered barrel is not necessarily a recovered route. It may reach its buyer after longer sailing time, additional handling, higher freight charges and elevated security costs. That extra complexity is economically important even if headline export tonnage appears healthier.
Insurance as a second chokepoint
War-risk coverage is a critical commercial constraint. Insurers assess the likelihood of a vessel being damaged, detained or unable to complete its voyage. Owners and charterers must decide whether premiums and contract terms are acceptable. A large increase in required coverage can deter normal cargo movements even where navigation remains physically possible.
Changing conditions also complicate freight pricing. Tanker availability may be constrained if vessels are stuck, diverted or committed to long journeys. Higher tanker day rates and delays can feed into delivered energy costs independent of the benchmark price of crude.
Implications for oil prices, diesel and LNG
Crude oil prices reflect both immediate supply and expectations about future supply. A security incident can raise risk premiums before cargo volumes fall. Conversely, an announcement suggesting lower tension can reduce futures prices without instantly reopening commercial routes.
Refined petroleum products are a separate problem. Gasoline, diesel and jet fuel depend on refinery operations, product-specific export terminals, storage and specialized trading networks. Even when crude output rebounds, damaged or curtailed refinery operations can keep particular fuels scarce. The EIA’s July 2026 analysis described how Middle East disruptions changed petroleum-product sourcing and strengthened refining margins in some other markets.
LNG adds another layer. Gas shipments operate with their own contracts, terminal capacity and vessel availability. An oil-volume recovery does not necessarily describe the state of gas markets.
What should businesses watch next?
Instead of relying on a single dramatic headline, an energy buyer or logistics manager should monitor the following signals together:
- Security incidents: independently confirmed vessel strikes and official maritime risk notices.
- Physical passages: comparable daily and weekly vessel counts using consistent definitions.
- Commodity throughput: crude, refined products and gas separately, not one blended total.
- Freight and insurance: costs of obtaining transportation and coverage for the route.
- Alternative routes: operational pipeline and port capacity, not merely theoretical map distances.
- Refinery status: the availability of usable finished fuels, especially diesel and jet fuel.
Political announcements also matter, but market conditions are shaped by whether ships actually sail and cargo reaches buyers.
Frequently asked questions
Where is the Strait of Hormuz?
It lies between Iran to the north and Oman and the United Arab Emirates region to the south, linking the Persian Gulf with the Gulf of Oman and the Arabian Sea.
Is any shipping still getting through?
Yes. Reuters and Lloyd’s List reported continued, restricted vessel traffic during October 2026. A full shutdown of every vessel would misrepresent these observations.
Why are ship counts and barrels per day different?
Ships vary in size, type and how fully they are loaded. Some vessels transport crude, others products or gas. A transit count and an oil-volume estimate answer different questions.
Does a rise in crude exports mean the crisis is over?
No. Alternative routing, increased insurance costs and attacks can persist even when headline crude export volumes improve.
Which countries face the greatest exposure?
Gulf producers and energy-importing economies are directly exposed, but freight costs, energy prices and financial-market volatility can transmit effects globally.
What should readers trust when forecasts conflict?
Prefer clearly dated EIA data, Reuters reporting and specialist Lloyd’s List methodology. Check both the underlying date and the definition of a transit.
Bottom line
Hormuz is not just a map location. It is a chain of commercial decisions shaped by security, insurance, shipping capacity and energy infrastructure. The October attacks demonstrate how an apparent recovery in some cargo flows can coexist with an intensely risky transportation environment. The most useful reporting separates what has been verified today from historical context and what could happen next.

Diesel Prices 2026–2027: Why Cheaper Crude May Not Mean Cheap Fuel

2027 Social Security COLA: Key Details and Dates

KSE-100 Sees Major Drop Post-SBP Rate Hike

Big Tech’s AI Spending Test: Can Revenue Catch Up With Capital Expenditure?

AI Infrastructure Investment Strategies for 2026

Pakistan Freelancers Tax 2026: Payments, Documentation and Formal Growth

Strait of Hormuz Crisis: What the Latest Tanker Attacks Mean for Oil, Shipping and Global Trade

AI Customer Service in 2026: What’s Working, What’s Failing, and What to Buy

Open a Savings Account Online: How to Actually Earn 10x the National Average Rate

Global Housing Market 2026: Where Prices Rise, Where They Don’t

PSX and KSE-100 Record Highs: An Insider’s Guide to Pakistan Stocks

So Delicious Dessert Recall: Affected Products, FDA Guidelines, and Consumer Action

Pakistan’s Current Account Deficit Narrows Sharply to $98 Million in August 2026

Japan Eyes 3.5% Defense Spending: What It Means for Bonds, Stocks, and the BOJ

Top 15 Stocks for Investment in 2026 in PSX: Your Complete Guide to Pakistan’s Best Investment Opportunities
Top 15 Stocks for Investment in 2026 in PSX: Your Complete Guide to Pakistan’s Best Investment Opportunities

Debunking IMF Program Myths: Reconfiguring Engagement for True National Ownership in a Volatile World

Top 10 Mutual Fund Managers in Pakistan for Investment in 2026: A Comprehensive Guide for Optimal Returns

China’s 50% Domestic Equipment Rule: The Semiconductor Mandate Reshaping Global Tech

What the U.S. Attack on Venezuela Could Mean for Oil and Canadian Crude Exports: The Economic Impact

15 Most Lucrative Sectors for Investment in Pakistan: A 2025 Data-Driven Analysis

How to Become an Active Taxpayer on Pakistan’s FBR Active Taxpayer List (ATL) in 2026: A Step-by-Step Guide

Pakistan’s Export Goldmine: 10 Game-Changing Markets Where Pakistani Businesses Are Winning Big in 2025

Pakistan’s Stock Market Renaissance: How 2025’s Hottest Investment Opportunity Is Democratizing Wealth—A Complete Beginner’s Guide

Best Investments in Pakistan 2026: Top 10 Low-Price Shares and Long-Term Picks for the PSX
15 Most Lucrative Sectors for Investment in Pakistan: A 2025 Data-Driven Analysis
15 Most Lucrative Sectors for Investment in Pakistan: A 2025 Data-Driven Analysis

Pakistan’s Economic Outlook 2025: Between Stabilization and the Shadow of Stagnation
-
 Markets & Finance10 months ago
Top 15 Stocks for Investment in 2026 in PSX: Your Complete Guide to Pakistan’s Best Investment Opportunities
-
Markets & Finance10 months ago
Top 15 Stocks for Investment in 2026 in PSX: Your Complete Guide to Pakistan’s Best Investment Opportunities
-
 Analysis9 months ago
Debunking IMF Program Myths: Reconfiguring Engagement for True National Ownership in a Volatile World
-
 Investment10 months ago
Top 10 Mutual Fund Managers in Pakistan for Investment in 2026: A Comprehensive Guide for Optimal Returns
-
 Asia10 months ago
China’s 50% Domestic Equipment Rule: The Semiconductor Mandate Reshaping Global Tech
-
 Global Economy10 months ago
What the U.S. Attack on Venezuela Could Mean for Oil and Canadian Crude Exports: The Economic Impact
-
 AI11 months ago
15 Most Lucrative Sectors for Investment in Pakistan: A 2025 Data-Driven Analysis
-
 Taxes & Compliance10 months ago
How to Become an Active Taxpayer on Pakistan’s FBR Active Taxpayer List (ATL) in 2026: A Step-by-Step Guide