
Global Economy
The Great Factory Shuffle: Can Pakistan Catch China’s Manufacturing Spillover?

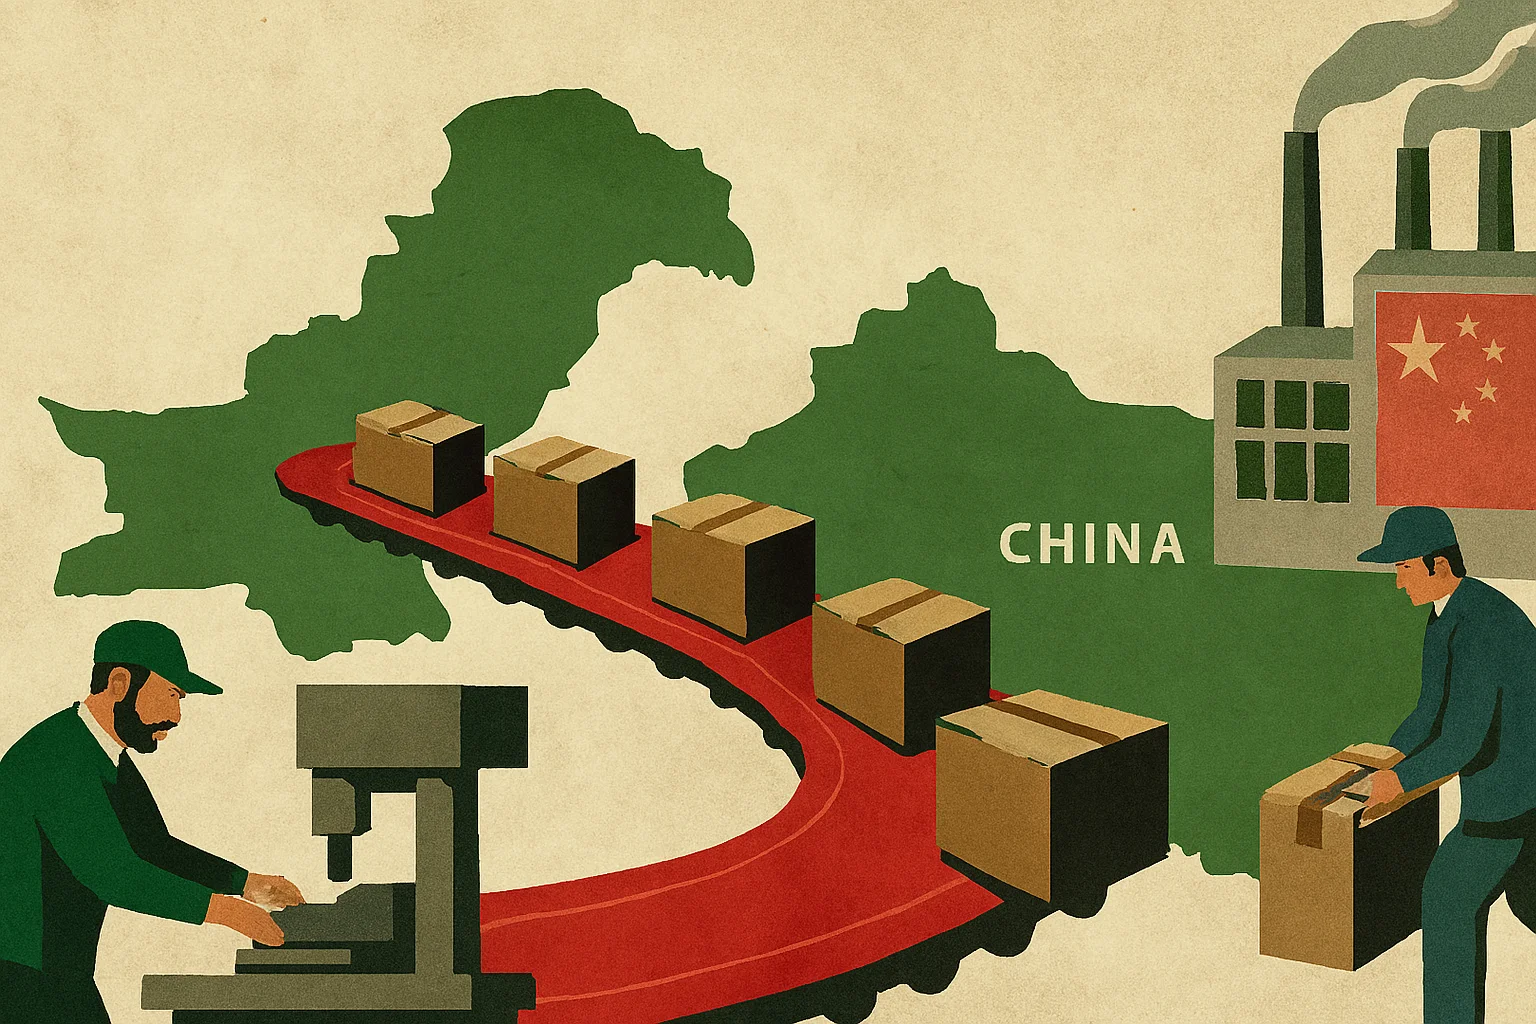
As global supply chains redraw themselves, Pakistan eyes an opening. But opportunity, like investment, prefers certainty.An Economist’s analysis of whether Pakistan can capture manufacturing shifts away from China amid tariff shocks, ASEAN competition, and global supply‑chain realignment. Includes comparative data, SEO‑aligned insights, and a forward‑looking verdict.
Executive Summary
China’s long reign as the world’s workshop is being nudged—gently by rising wages, firmly by geopolitics, and abruptly by tariff regimes that have turned supply chains into diplomatic battlegrounds. ASEAN economies have already emerged as prime beneficiaries, with Chinese manufacturing FDI accelerating into Vietnam, Malaysia, and Indonesia. Pakistan, meanwhile, sits on the periphery of this realignment: geographically strategic, economically under‑utilised, and chronically inconsistent.
This article examines whether Pakistan can realistically capture a slice of the “China+1” diversification wave. It compares industrial land costs, energy tariffs, labour productivity, logistics performance, and export‑processing capacity across Pakistan, China, Vietnam, Bangladesh, and ASEAN peers. The conclusion is neither triumphalist nor fatalistic: Pakistan has a narrow window, but only if it can deliver reliability—something investors value more than cheap land or poetic promises.
A shifting workshop
For decades, China has been the gravitational centre of global manufacturing. Its ports hummed, its factories glowed, and its supply chains ran with the precision of a Swiss watch—albeit one assembled at industrial scale. But the world’s workshop is undergoing a quiet rearrangement. Rising wages, demographic shifts, and geopolitical tariffs—some exceeding 30% on Chinese-linked exports to the United States—have encouraged firms to diversify. The “China+1” strategy, once a consultant’s buzzword, is now a boardroom imperative.
ASEAN economies have been the early winners. Vietnam’s manufacturing FDI inflows surged as firms sought tariff‑free access to Western markets and lower geopolitical risk premiums. Bangladesh, too, has ridden the wave in textiles. Pakistan, by contrast, has mostly watched from the sidelines, occasionally waving from its Special Economic Zones (SEZs) like a hopeful host awaiting guests who never quite arrive.
Yet the opportunity is real. The question is whether Pakistan can seize it—or whether it will once again be outpaced by nimbler neighbours.
Industrial land: cheap, but not cheerful
Industrial land is Pakistan’s first selling point. SEZ plots under the China‑Pakistan Economic Corridor (CPEC) range from $30–$60 per square metre, significantly cheaper than Vietnam’s industrial zones, where prices often exceed $100–$150 per square metre. Bangladesh sits somewhere in between, with zones priced around $50–$90.
But cost is only half the story. Zoning clarity, titling security, and utility readiness matter more. Here Pakistan’s advantage evaporates. Investors routinely complain of:
- Delayed land possession
- Incomplete utilities at “ready” sites
- Fragmented provincial regulations
China, by contrast, offers plug‑and‑play industrial parks with near‑instant utility hookups. Vietnam’s zones, though pricier, offer reliability—an attribute investors treat as a premium good.
Energy: the Achilles’ heel
Energy tariffs in Pakistan are among the highest in Asia on a cost‑per‑unit basis. Industrial electricity rates hover around $0.14–$0.18/kWh, compared with:
- Vietnam: ~$0.08–$0.10
- Bangladesh: ~$0.09
- China: ~$0.08–$0.12
Pakistan’s chronic circular debt, load‑shedding, and grid instability further erode competitiveness. Uptime—a metric manufacturers obsess over—remains inconsistent. A factory that loses power for even 30 minutes a week loses contracts in industries where seconds matter.
Digital uptime is no better. Server‑level reliability and data‑centre redundancy lag behind ASEAN peers, limiting Pakistan’s attractiveness for high‑tech assembly or integrated supply‑chain operations.
Labour: abundant but uneven
Pakistan’s labour force is young and inexpensive, with manufacturing wages averaging $150–$170 per month, lower than Vietnam’s $250–$300 and China’s $600+. But productivity tells a different story.
Vietnam’s labour productivity has grown rapidly due to vocational training and FDI‑driven skill transfer. Bangladesh, despite lower wages, has achieved enviable efficiency in garments through scale and process discipline.
Pakistan’s productivity remains inconsistent, hampered by:
- Limited vocational training
- Low female labour‑force participation
- Weak firm‑level management practices
Cheap labour is not enough; efficient labour is what investors seek.
Logistics: geography helps, governance hinders
Pakistan’s geography is enviable. It sits at the crossroads of South Asia, Central Asia, and the Middle East. Karachi Port and Port Qasim handle the bulk of trade, while Gwadar remains more promise than port.
Yet logistics performance lags. Pakistan’s Logistics Performance Index (LPI) score trails Vietnam and China, reflecting slower customs clearance, weaker warehousing, and inconsistent transport corridors.
China’s Belt and Road investments were meant to fix this. But CPEC’s industrial zones remain incomplete, and transport corridors—while improved—still lack the seamless integration seen in ASEAN.
Export‑processing capacity: the missing middle
China’s export‑processing zones are legendary for their efficiency. Vietnam has replicated the model with surprising speed, offering:
- 24/7 customs
- Integrated bonded warehouses
- Fast‑track approvals
Pakistan’s export‑processing zones (EPZs), by contrast, are small, bureaucratic, and under‑utilised. Processing times are slower, and regulatory exemptions are narrower. Investors seeking speed—especially in electronics, garments, and auto parts—prefer environments where paperwork does not outlive the product cycle.
FDI flows: following the path of least resistance
FDI follows predictability. ASEAN economies have become top destinations for Chinese manufacturing FDI, driven by tariff arbitrage and supply‑chain diversification. Vietnam, Malaysia, and Indonesia now attract billions annually.
Pakistan’s FDI inflows, meanwhile, remain modest. Tariff‑driven trade diversion may offer temporary relief—analysts note that US tariffs on Bangladesh, Vietnam, and China could redirect some trade toward Pakistan—but such shifts are opportunistic, not structural.
Investors want ecosystems, not episodes.
Geopolitics: a double‑edged sword
Pakistan’s strategic alignment with China is both an asset and a liability. On one hand, it offers access to Chinese capital, technology, and supply‑chain integration. On the other, it exposes Pakistan to geopolitical risk premiums—especially in Western markets wary of Chinese value‑chain entanglement.
Vietnam, by contrast, has mastered the art of being everyone’s friend and no one’s satellite. Bangladesh has positioned itself as politically neutral and commercially predictable.
Pakistan’s foreign‑policy posture, while improving, still carries perceived volatility.
Can Pakistan capture the opportunity?
The short answer: yes, but only if it fixes reliability.
Pakistan does not need to match China’s scale or Vietnam’s efficiency. It needs to offer a credible alternative for specific industries:
- Textiles and apparel
- Leather and footwear
- Light engineering
- Home appliances
- Auto parts
- Low‑to‑mid‑tech assembly
But credibility requires reforms in five areas:
- Energy reliability — uninterrupted power at competitive tariffs.
- Industrial land readiness — plug‑and‑play zones, not promises.
- Logistics modernisation — faster ports, digitised customs, integrated corridors.
- Labour productivity — vocational training aligned with industry needs.
- Regulatory predictability — stable policies, fewer surprises.
Without these, Pakistan will remain a spectator in Asia’s manufacturing reshuffle.
A forward‑looking verdict
The global manufacturing map is redrawing itself. China’s shift is real; ASEAN’s rise is undeniable; Bangladesh’s discipline is instructive. Pakistan has the ingredients for competitiveness but lacks the consistency investors crave.
If Pakistan can deliver reliability—of power, policy, and process—it could capture a meaningful share of the China+1 wave. If not, the country risks watching yet another industrial revolution pass by, waving politely from the sidelines.
Data Highlights Table
| Indicator | Pakistan | China | Vietnam | Bangladesh | ASEAN Avg |
|---|---|---|---|---|---|
| Industrial land cost ($/sqm) | 30–60 | 120–300 | 100–150 | 50–90 | 80–200 |
| Electricity tariff ($/kWh) | 0.14–0.18 | 0.08–0.12 | 0.08–0.10 | ~0.09 | 0.08–0.12 |
| Monthly manufacturing wage ($) | 150–170 | 600+ | 250–300 | 120–150 | 250–400 |
| LPI score (0–5) | ~2.4 | ~3.6 | ~3.3 | ~2.6 | ~3.0 |
| FDI inflows (manufacturing) | Low | Very high | High | Moderate | High |
| Export‑processing efficiency | Low | Very high | High | Moderate | High |
Some contextual insights informed by search results on tariff‑driven diversification and ASEAN’s FDI surge.


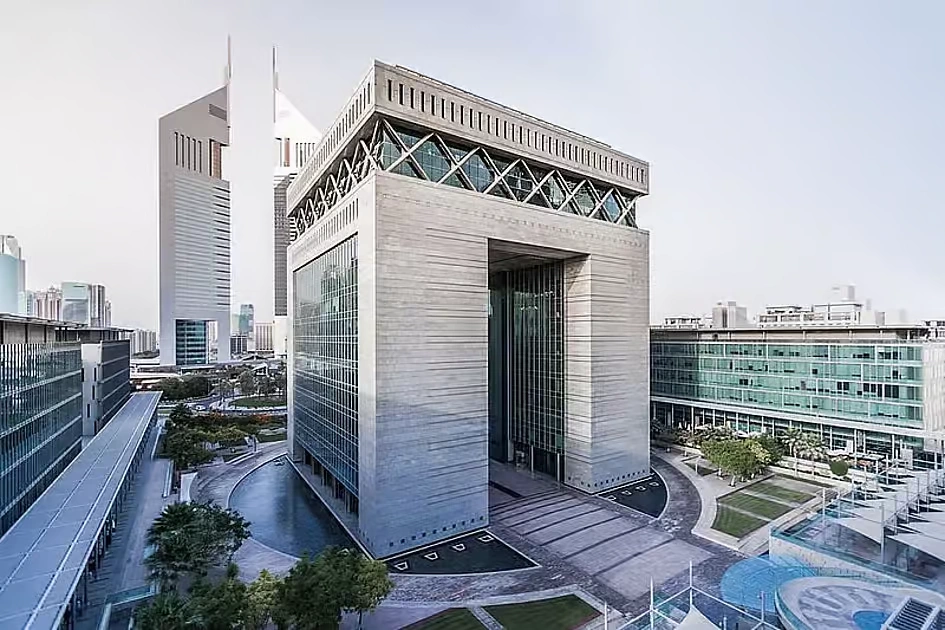
Dubai has climbed to its highest position ever on one of finance’s most closely watched rankings, and the achievement is no accident — it is the direct output of a decade-long, numerically explicit government strategy that few other financial centres have attempted to execute with this level of precision.
The Ranking Itself
The Dubai International Financial Centre has recorded its highest-ever position on the Global Financial Centres Index at seventh place worldwide, the highest ranking ever achieved by any financial centre across the Middle East, Africa and South Asia region, and the only MEASA-region centre to feature in the global top 20 — underscoring both its regional dominance and genuine global competitiveness.
The D33 Strategy Behind the Number
The ranking is explicitly tied to Dubai’s own stated ambitions. The GFCI result is described as pivotal to Dubai’s goal of becoming one of the world’s top four financial centres by 2033, in line with the Dubai Economic Agenda, or D33, which targets a doubling of the emirate’s economy over the decade. Separately, Dubai Chambers has confirmed the plan targets cumulative economic output of AED 32 trillion, or roughly $8.7 trillion, over the decade, supported by 100 transformative projects centred on trade expansion, digital innovation and sustainable growth.
The Underlying Economic Engine
The financial-centre ambitions are backed by genuine current-quarter growth. Dubai’s economy reached AED 232 billion in first-quarter 2026 GDP, a 2.4 percent year-on-year increase, with the finance, construction, healthcare, wholesale and retail trade, and real estate sectors all contributing to the broad-based expansion. Middle East Briefing separately projects the wider UAE economy will expand around 5 percent in 2026, with local banks positioned to increase lending both domestically — supporting SMEs, consumers and project finance — and across borders into markets like Saudi Arabia, where UAE banks’ comparatively lower interbank rates create an arbitrage opportunity.
Real Money Behind the Ranking
The GFCI climb is being validated by tangible transaction volume rather than sentiment alone. Weekly UAE business tracking shows a steady drumbeat of institutional activity: Sharjah Islamic Bank reported AED 803.9 million in net profit, up 15.3 percent, ADI Chain secured a $50 million investment to build sovereign digital infrastructure, and Capital.com reported $1.1 trillion in second-quarter trading volume routed through the jurisdiction. Separately, UAE and Saudi banks are projected to lead GCC credit growth in 2026, reinforcing Dubai and Abu Dhabi’s combined position as the region’s default financial gateway.
Why This Matters for Pakistan and South Asia
Dubai’s ascent as a financial hub carries direct relevance for Pakistan, where — as detailed in our companion coverage of Pakistan’s remittance exposure — roughly 55 percent of the country’s substantial remittance inflows originate from the Gulf Cooperation Council. A deepening, increasingly sophisticated DIFC-anchored financial ecosystem in Dubai means more efficient, lower-cost channels for that capital, alongside growing opportunities for Pakistani and South Asian firms to access GCC-sourced project finance and cross-border credit as UAE banks expand lending beyond their domestic market.
What is Dubai’s global financial centre ranking in 2026?
Dubai’s DIFC recorded its highest-ever ranking on the Global Financial Centres Index at 7th place worldwide in 2026 — the highest ever achieved by any Middle East, Africa or South Asia financial centre — as part of its stated goal to become a top-four global financial hub by 2033.
The Risk Beneath the Growth Story
Not every signal points to unambiguous strength. AGBI’s own reporting notes that UAE banks’ second-quarter results are likely to show weaker profits, slower lending and narrower margins, even as analysts characterise the underlying sector as fundamentally resilient — a reminder that Dubai’s financial-hub ambitions are being pursued against a genuinely more difficult regional operating environment shaped by the Strait of Hormuz disruption and broader Gulf security concerns, not in isolation from them.
The Bottom Line
Dubai’s climb to seventh in the GFCI rankings is less a one-off achievement than a measurable checkpoint on an explicitly numbered, decade-long strategic roadmap — one increasingly backed by real GDP growth, credit expansion, and institutional trading volume rather than ambition alone.
Analysis
Global Central Bank Divergence 2026: Why the Fed, BoE, BoJ, and PBoC Are All Moving Differently
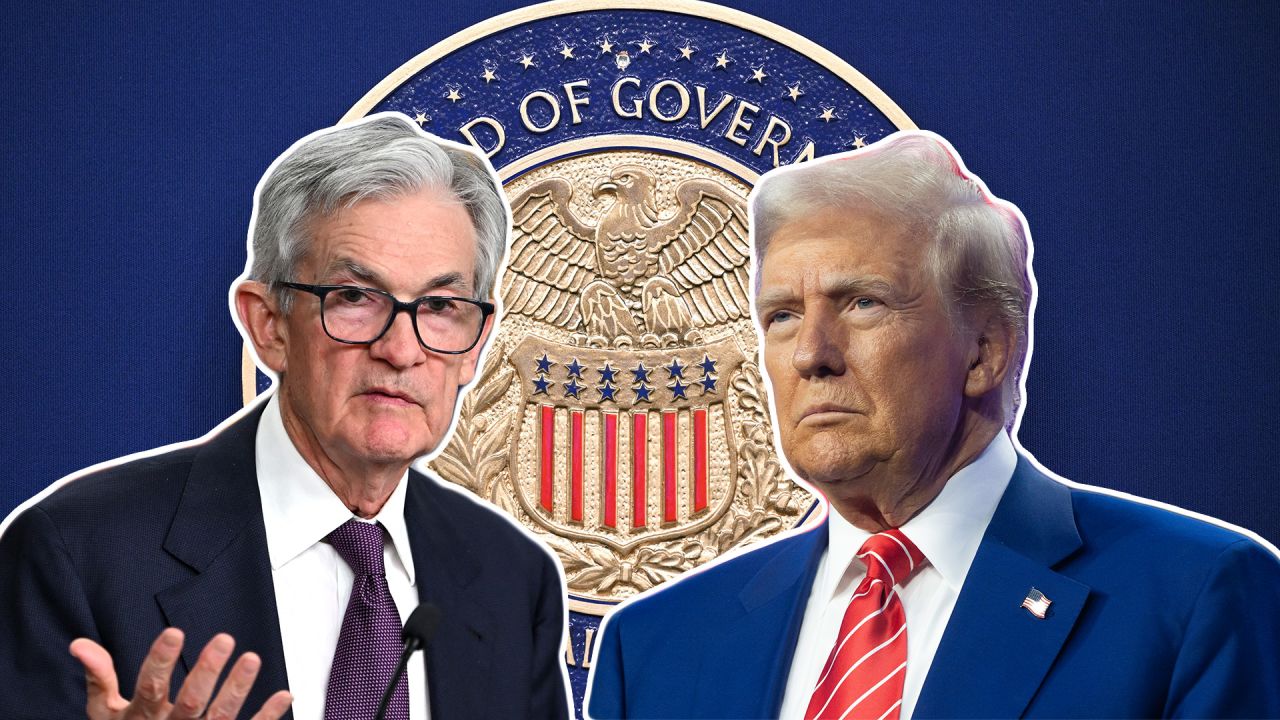
The world’s major central banks are no longer moving in anything resembling lockstep. The Federal Reserve is watching a weakening labor market while weighing energy-driven inflation risk, the Bank of Japan is scaling back bond purchases into a fiscal expansion, the Bank of Russia is cutting rates through sanctions-driven stagnation, and the Bank of England is openly discussing a hike rather than the cuts it signaled just months ago, a divergence in global monetary policy that reflects how unevenly the Iran war’s economic shock has landed across different economies.
The Fed’s Data-Dependent Pivot
Federal Reserve Chairman Kevin Warsh has explicitly asked markets to look to incoming data rather than central bank guidance to map the path for US interest rates, a communication shift that took on new significance after June’s jobs report showed just 57,000 new positions, roughly half the expected pace, according to Yahoo Finance’s markets coverage. Warsh has separately said inflation risks have eased substantially, a combination that has markets betting on a more accommodative Fed even as the central bank has offered no formal commitment ahead of its July 30 decision.
The Bank of England’s Reversal
Few central banks illustrate the scale of the pivot as clearly as the Bank of England. Governor Andrew Bailey said market pricing for two rate cuts this year had looked reasonable before the Iran war lifted inflation risks, according to the Credit Protection Association’s reporting, a statement that effectively closed the door on the easing path the Bank had signaled entering 2026. With UK inflation forecast to climb back toward 3.5% by year end and the base rate held at 3.75%, RSM UK’s analysis suggests a hike, not a cut, is now the more live possibility for the Bank’s July 30 decision, timed to land the same day as the Fed’s own announcement.
Canada and the Bank of Canada’s Cautious Hold
The Bank of Canada has held its policy rate at 2.25% since the spring, balancing a genuinely fragile domestic economy, technically in recession by some measures, against the same energy-driven inflation pressure affecting the UK, according to the central bank’s own announcement. Unlike the Fed or Bank of England, the Bank of Canada’s dilemma is compounded by an unresolved CUSMA trade review, meaning its policy path depends as much on trade negotiation outcomes as on conventional inflation and employment data.
Russia’s Disinflation Campaign, Slowed but Not Abandoned
At the opposite extreme sits the Bank of Russia, which has cut its key rate eight consecutive times since June 2025, from a record 21% down to 14.25% by its June 2026 decision, even as annual inflation remains at 5.6%, well above its 4% target, according to the central bank’s own data. Governor Elvira Nabiullina’s cutting cycle reflects a fundamentally different set of pressures than Western central banks face: a wartime economy where fiscal policy, not conventional demand, drives the inflation picture, and where the central bank’s June cut of just 25 basis points, smaller than the market’s expected 50, signals genuine caution about cutting too fast into persistent pro-inflationary risk from higher domestic energy costs.
Asia’s Split Response
Indonesia and Malaysia illustrate how differently emerging Asian economies are navigating the same global energy shock. Bank Indonesia has held its rate at 4.75% for seven consecutive meetings specifically to defend the rupiah, which has weakened 3.6% year-to-date, according to McKinsey’s regional review, prioritizing currency stability over the growth-supportive easing its 5.61% GDP growth might otherwise justify. Bank Negara Malaysia, by contrast, has benefited from a currency that has held relatively firm, giving it more flexibility, though inflation drifting toward the top of its 1.5% to 2.5% target range, per The Edge Malaysia’s reporting, suggests that flexibility may narrow through the second half of the year.
Japan sits furthest from the rest of the pack. The Bank of Japan has been reducing its own bond purchases even as 10-year Japanese government bond yields have climbed above 2.75%, their highest level since May 2026, according to Trading Economics, a tightening-adjacent move driven as much by concern over Prime Minister Sanae Takaichi’s fiscal expansion plans as by conventional inflation targeting.
China’s Different Problem Entirely
China’s central bank faces a problem none of its peers share: six consecutive quarters of deflation rather than inflation. Societe Generale economist Wei Yao has suggested Chinese bond yields could fall to record lows in 2026 as the People’s Bank of China continues easing, a view consistent with Beijing’s own base case of roughly RMB 1 trillion in additional fiscal stimulus alongside 20 basis points of rate cuts and 50 basis points of reserve requirement ratio cuts, according to Citi Research’s 2026 outlook, cited via Asia Times’ coverage of the Politburo’s domestic demand pivot.
What This Divergence Actually Means
The practical consequence of seven major central banks pursuing seven distinct policy paths is a global capital markets environment where currency volatility, carry trade dynamics, and cross-border capital flows have become considerably harder to forecast using any single macro framework. When Japan’s ultra-low yields anchored global borrowing costs and most Western central banks moved in broad cyclical alignment, currency and rate forecasting rested on relatively stable assumptions about global monetary conditions. That anchor is now gone. Investors positioning across UK gilts, US Treasurys, Japanese government bonds, and emerging Asian debt in the second half of 2026 face a genuinely fragmented policy landscape, one where the same global shock, the Iran war’s energy price spike, has produced hikes, holds, and cuts in near-equal measure depending entirely on each economy’s starting fiscal position, currency exposure, and domestic political constraints.
Rich Nations Face Make‑or‑Break Moment at COP31 Preparatory Talks
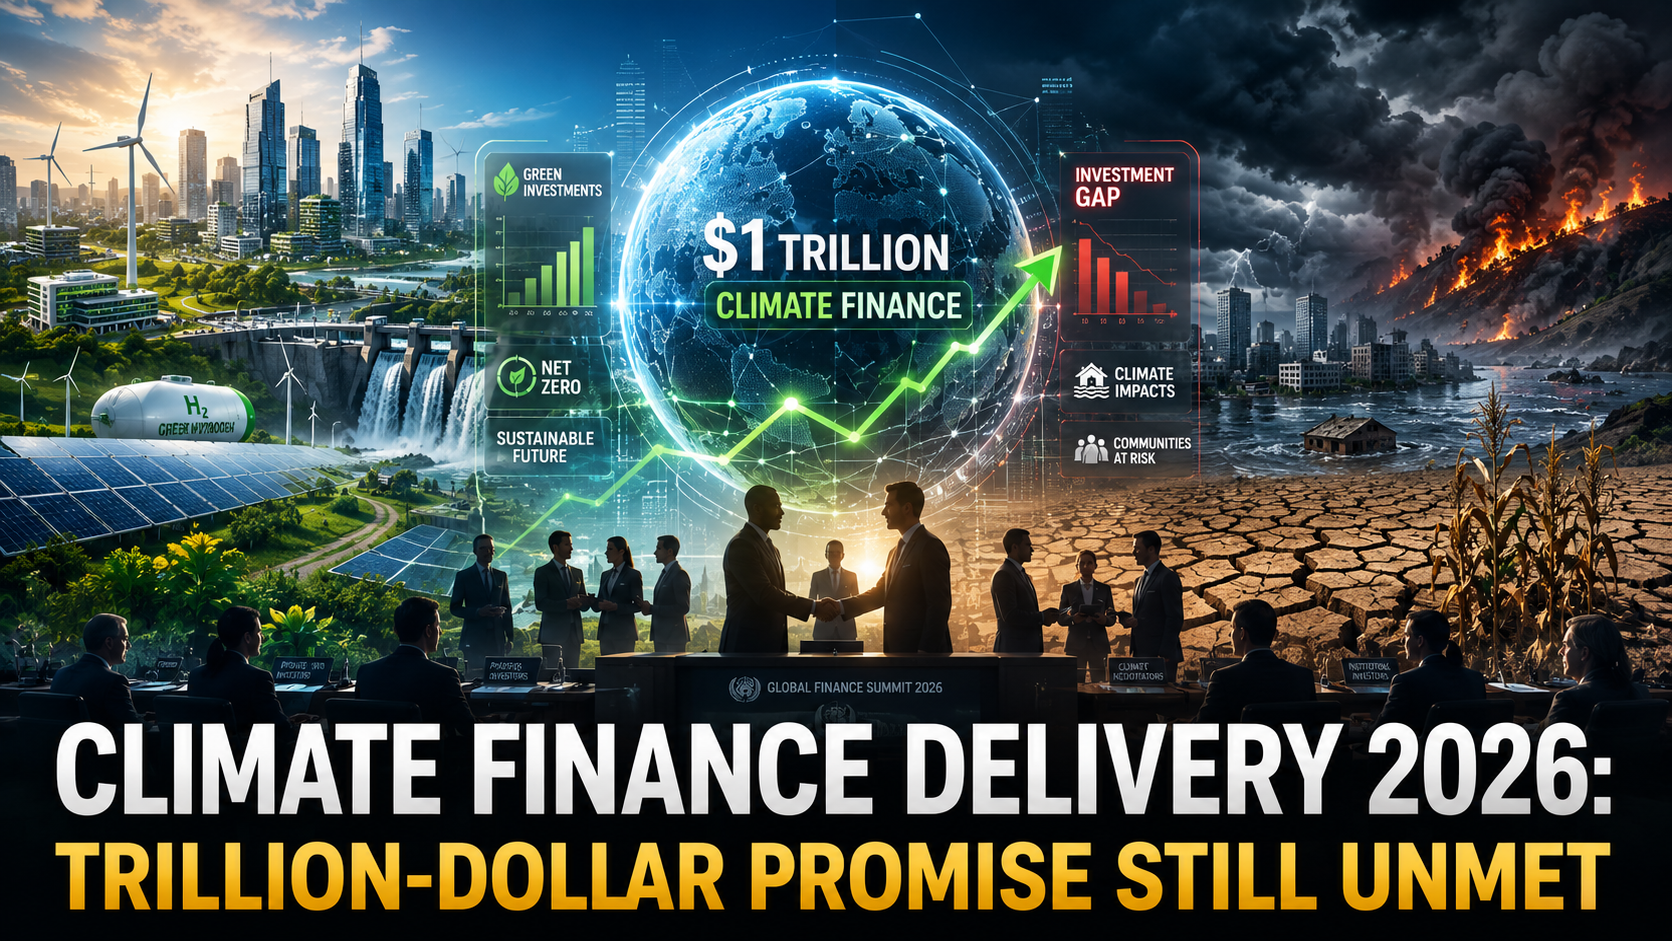
The United Nations Framework Convention on Climate Change (UNFCCC) has released a sobering assessment: climate finance delivery 2026 remains a staggering $1.1 trillion short of the $2.4 trillion that developing countries need annually to transition to low‑carbon economies and adapt to climate impacts (UNFCCC Standing Committee on Finance, June 2026). The report, published ahead of the pre‑COP31 ministerial in Bonn, reveals that total climate finance flows reached $1.3 trillion in 2024 (the latest available data), virtually flat from 2023. While the number is a record in absolute terms, the chasm between what is provided and what is needed is widening, not narrowing.
The Structure of the Shortfall
The $2.4 trillion annual need is broken down into three components: $1.2 trillion for mitigation (clean energy, industry decarbonisation), $800 billion for adaptation (sea walls, drought‑resilient crops, early warning systems), and $400 billion for loss and damage (compensation for unavoidable climate impacts). Currently, mitigation receives the lion’s share of finance—over 85%—mostly in the form of loans that add to debt burdens. Adaptation, which is most critical for the poorest countries, receives only $130 billion, and loss and damage, despite the operationalisation of a dedicated fund at COP28 in 2023, has seen a mere $2 billion in pledges against the $400 billion ask.
The loss and damage fund, a hard‑won victory for vulnerable nations, is emblematic of the gap between rhetoric and reality. Rich countries have committed just 0.5% of what the UNFCCC secretariat estimates is required for countries like Pakistan (2022 floods), Vanuatu (cyclones), and the Sahel (desertification) to rebuild in a climate‑resilient manner. The World Bank, which hosts the fund, has been slow to disburse, and the US, historically the largest historical emitter, has contributed only $500 million, a fraction of its fair share (World Bank Loss and Damage Fund Update, June 2026).
The NCQG Negotiations: Who Pays?
The NCQG negotiations (new collective quantified goal on climate finance) are the central battlefield of COP31, scheduled for November 2026 in Brasília. The current goal, set at COP15 in 2009, was $100 billion a year by 2020—a target met only in 2022. The new goal must reflect the drastically increased needs and a broader donor base. The EU and the US are insisting that China, now the world’s largest emitter and the second‑largest economy, must become a formal contributor, arguing that the 1992 division of the world into “Annex I” (developed) and “non‑Annex I” (developing) is outdated. China and the G77+China grouping counter that historical responsibility and per‑capita emissions still place the primary obligation on the old industrial powers.
The deadlock has been partially broken by a bridging proposal from the COP31 presidency (Brazil) that would create a three‑tiered system: Tier 1 contributors (traditional donors) would provide grants and concessional finance; Tier 2 contributors (high‑income developing countries like China, Saudi Arabia, Singapore) would provide non‑concessional loans and technology transfer; and Tier 3 contributors (multilateral development banks) would leverage their balance sheets to mobilise private capital. The proposal would set a cumulative target of $1.5 trillion a year by 2030, but the tiers’ shares remain hotly contested (UNFCCC, Pre‑COP31 Ministerial Draft Text, June 2026).
Mobilising Private Finance: The MDB Reform Agenda
Given the fiscal constraints in donor countries, the real engine of increased climate finance must be the multilateral development banks (MDBs) and the private sector. The World Bank, under its new president, has implemented the recommendations of the G20 Capital Adequacy Framework review, which could unlock an additional $100 billion in lending headroom over a decade without requiring new capital. The Bank is launching a new “Climate Enhanced” bond, where coupon payments are linked to verified emission reduction outcomes in a portfolio of African clean‑cooking and reforestation projects, targeting institutional investors hungry for impact‑linked returns (World Bank, Outcome Bond Issuance, June 2026).
The International Finance Corporation is expanding its “Green Up” guarantee facility, which de‑risks private investments in emerging‑market renewable energy by covering first‑loss risks. The Glasgow Financial Alliance for Net Zero (GFANZ) has evolved from a coalition of pledges to a set of country‑specific investment platforms: in Vietnam, a Just Energy Transition Partnership has mobilized $15 billion, and in Senegal, a similar platform is targeting $5 billion for solar and green hydrogen. These vehicles blend public concessional capital with private investment, but scaling them to the $2.4 trillion level remains aspirational.
The Cost of Inaction
The UNFCCC report emphasizes that every year of underfunding magnifies the eventual bill. The cost of inaction—measured in destroyed infrastructure, lost crop yields, and health crises—is accelerating. Swiss Re estimates that unabated climate change could reduce global GDP by 11% by 2050 (Swiss Re Institute, “Climate Economics”, 2026). For the private sector, climate risk is already material: supply chains are being disrupted by floods in Bangladesh and droughts in Panama, and insurance coverage is retreating from vulnerable regions, leaving assets stranded. The business case for closing the climate finance gap is not charitable; it is self‑interest.
The pre‑COP31 talks in Bonn are being described by veteran negotiators as the most consequential since Copenhagen 2009. The outcome will determine whether the Paris Agreement’s 1.5°C target remains within reach. The message from the UNFCCC is unambiguous: the world’s financial architecture is not fit for purpose in the face of a climate emergency, and the window for reform is closing fast.

Pakistan’s Remittance Lifeline: Why Gulf Exposure Is a Hidden Risk

Dubai’s Rise to the World’s 7th Financial Hub: Inside the D33 Push

China EV Exports Hit Record High in 2026

UK’s “National Contributions Tax” Explained: Burnham-Era Reform 2026

Russia’s Strange Problem in 2026: Its Currency Is Too Strong

Section 301 Forced Labor Tariffs 2026: 60 Countries Affected

UK National Contributions Tax: Burnham’s Radical Tax Plan

Global Central Bank Divergence 2026: Why the Fed, BoE, BoJ, and PBoC Are All Moving Differently

Japan’s Bond Market Just Cracked. It Could Take the Rest of the World’s Debt With It

Malaysia’s Ringgit Is Holding Up. Economists Say the Real Test Is Still Coming

Climate Finance Delivery 2026: Trillion‑Dollar Promise Still Unmet

AI Impact on Wages 2026: Productivity Soars, Paychecks Stagnate

SpaceX IPO 2026: $2 Trillion AI Bubble, OpenAI & Anthropic — What Investors Must Know

China Economy 2026: Property Crisis, AI Investment & Export Surplus Explained

Top 15 Stocks for Investment in 2026 in PSX: Your Complete Guide to Pakistan’s Best Investment Opportunities
Top 15 Stocks for Investment in 2026 in PSX: Your Complete Guide to Pakistan’s Best Investment Opportunities

Debunking IMF Program Myths: Reconfiguring Engagement for True National Ownership in a Volatile World

Top 10 Mutual Fund Managers in Pakistan for Investment in 2026: A Comprehensive Guide for Optimal Returns

What the U.S. Attack on Venezuela Could Mean for Oil and Canadian Crude Exports: The Economic Impact

China’s 50% Domestic Equipment Rule: The Semiconductor Mandate Reshaping Global Tech

15 Most Lucrative Sectors for Investment in Pakistan: A 2025 Data-Driven Analysis

Pakistan’s Export Goldmine: 10 Game-Changing Markets Where Pakistani Businesses Are Winning Big in 2025
15 Most Lucrative Sectors for Investment in Pakistan: A 2025 Data-Driven Analysis
15 Most Lucrative Sectors for Investment in Pakistan: A 2025 Data-Driven Analysis

Pakistan’s Economic Outlook 2025: Between Stabilization and the Shadow of Stagnation
Pakistan’s Economic Outlook 2025: Between Stabilization and the Shadow of Stagnation

China’s Property Woes Could Last Until 2030—Despite Beijing’s Best Censorship Efforts
China’s Property Woes Could Last Until 2030—Despite Beijing’s Best Censorship Efforts
-
 Markets & Finance7 months ago
Top 15 Stocks for Investment in 2026 in PSX: Your Complete Guide to Pakistan’s Best Investment Opportunities
-
Markets & Finance7 months ago
Top 15 Stocks for Investment in 2026 in PSX: Your Complete Guide to Pakistan’s Best Investment Opportunities
-
 Analysis6 months ago
Debunking IMF Program Myths: Reconfiguring Engagement for True National Ownership in a Volatile World
-
 Investment6 months ago
Top 10 Mutual Fund Managers in Pakistan for Investment in 2026: A Comprehensive Guide for Optimal Returns
-
 Global Economy7 months ago
What the U.S. Attack on Venezuela Could Mean for Oil and Canadian Crude Exports: The Economic Impact
-
 Asia7 months ago
China’s 50% Domestic Equipment Rule: The Semiconductor Mandate Reshaping Global Tech
-
 AI7 months ago
15 Most Lucrative Sectors for Investment in Pakistan: A 2025 Data-Driven Analysis
-
 Exports7 months ago
Pakistan’s Export Goldmine: 10 Game-Changing Markets Where Pakistani Businesses Are Winning Big in 2025