
Global Economy
The Great Factory Shuffle: Can Pakistan Catch China’s Manufacturing Spillover?

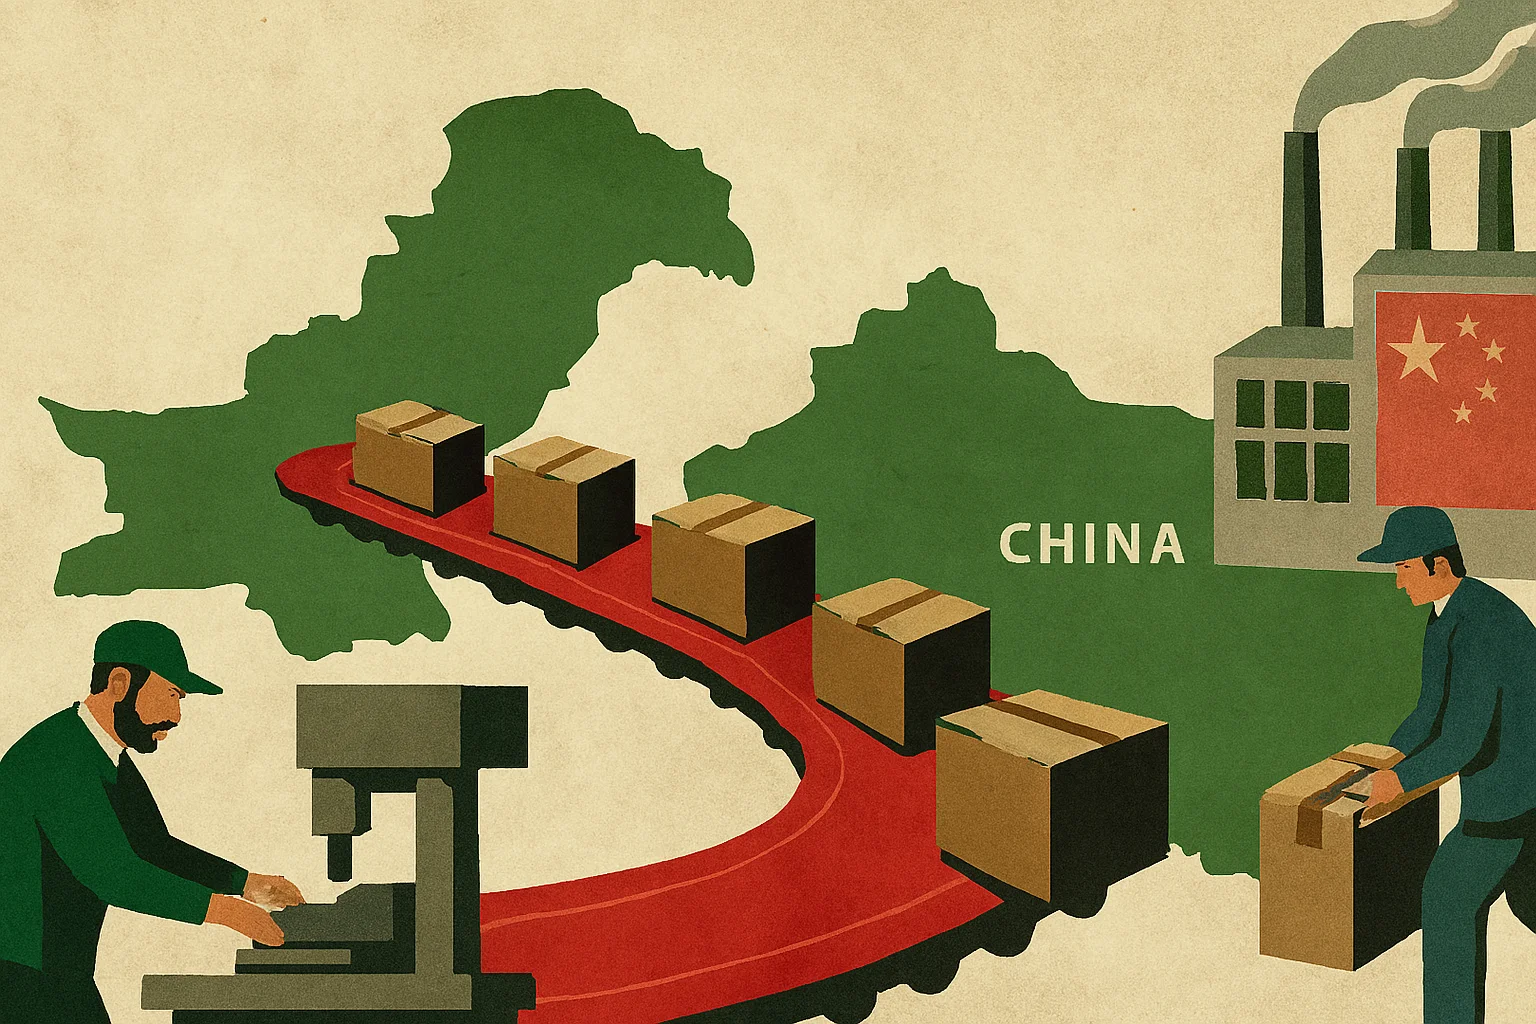
As global supply chains redraw themselves, Pakistan eyes an opening. But opportunity, like investment, prefers certainty.An Economist’s analysis of whether Pakistan can capture manufacturing shifts away from China amid tariff shocks, ASEAN competition, and global supply‑chain realignment. Includes comparative data, SEO‑aligned insights, and a forward‑looking verdict.
Executive Summary
China’s long reign as the world’s workshop is being nudged—gently by rising wages, firmly by geopolitics, and abruptly by tariff regimes that have turned supply chains into diplomatic battlegrounds. ASEAN economies have already emerged as prime beneficiaries, with Chinese manufacturing FDI accelerating into Vietnam, Malaysia, and Indonesia. Pakistan, meanwhile, sits on the periphery of this realignment: geographically strategic, economically under‑utilised, and chronically inconsistent.
This article examines whether Pakistan can realistically capture a slice of the “China+1” diversification wave. It compares industrial land costs, energy tariffs, labour productivity, logistics performance, and export‑processing capacity across Pakistan, China, Vietnam, Bangladesh, and ASEAN peers. The conclusion is neither triumphalist nor fatalistic: Pakistan has a narrow window, but only if it can deliver reliability—something investors value more than cheap land or poetic promises.
A shifting workshop
For decades, China has been the gravitational centre of global manufacturing. Its ports hummed, its factories glowed, and its supply chains ran with the precision of a Swiss watch—albeit one assembled at industrial scale. But the world’s workshop is undergoing a quiet rearrangement. Rising wages, demographic shifts, and geopolitical tariffs—some exceeding 30% on Chinese-linked exports to the United States—have encouraged firms to diversify. The “China+1” strategy, once a consultant’s buzzword, is now a boardroom imperative.
ASEAN economies have been the early winners. Vietnam’s manufacturing FDI inflows surged as firms sought tariff‑free access to Western markets and lower geopolitical risk premiums. Bangladesh, too, has ridden the wave in textiles. Pakistan, by contrast, has mostly watched from the sidelines, occasionally waving from its Special Economic Zones (SEZs) like a hopeful host awaiting guests who never quite arrive.
Yet the opportunity is real. The question is whether Pakistan can seize it—or whether it will once again be outpaced by nimbler neighbours.
Industrial land: cheap, but not cheerful
Industrial land is Pakistan’s first selling point. SEZ plots under the China‑Pakistan Economic Corridor (CPEC) range from $30–$60 per square metre, significantly cheaper than Vietnam’s industrial zones, where prices often exceed $100–$150 per square metre. Bangladesh sits somewhere in between, with zones priced around $50–$90.
But cost is only half the story. Zoning clarity, titling security, and utility readiness matter more. Here Pakistan’s advantage evaporates. Investors routinely complain of:
- Delayed land possession
- Incomplete utilities at “ready” sites
- Fragmented provincial regulations
China, by contrast, offers plug‑and‑play industrial parks with near‑instant utility hookups. Vietnam’s zones, though pricier, offer reliability—an attribute investors treat as a premium good.
Energy: the Achilles’ heel
Energy tariffs in Pakistan are among the highest in Asia on a cost‑per‑unit basis. Industrial electricity rates hover around $0.14–$0.18/kWh, compared with:
- Vietnam: ~$0.08–$0.10
- Bangladesh: ~$0.09
- China: ~$0.08–$0.12
Pakistan’s chronic circular debt, load‑shedding, and grid instability further erode competitiveness. Uptime—a metric manufacturers obsess over—remains inconsistent. A factory that loses power for even 30 minutes a week loses contracts in industries where seconds matter.
Digital uptime is no better. Server‑level reliability and data‑centre redundancy lag behind ASEAN peers, limiting Pakistan’s attractiveness for high‑tech assembly or integrated supply‑chain operations.
Labour: abundant but uneven
Pakistan’s labour force is young and inexpensive, with manufacturing wages averaging $150–$170 per month, lower than Vietnam’s $250–$300 and China’s $600+. But productivity tells a different story.
Vietnam’s labour productivity has grown rapidly due to vocational training and FDI‑driven skill transfer. Bangladesh, despite lower wages, has achieved enviable efficiency in garments through scale and process discipline.
Pakistan’s productivity remains inconsistent, hampered by:
- Limited vocational training
- Low female labour‑force participation
- Weak firm‑level management practices
Cheap labour is not enough; efficient labour is what investors seek.
Logistics: geography helps, governance hinders
Pakistan’s geography is enviable. It sits at the crossroads of South Asia, Central Asia, and the Middle East. Karachi Port and Port Qasim handle the bulk of trade, while Gwadar remains more promise than port.
Yet logistics performance lags. Pakistan’s Logistics Performance Index (LPI) score trails Vietnam and China, reflecting slower customs clearance, weaker warehousing, and inconsistent transport corridors.
China’s Belt and Road investments were meant to fix this. But CPEC’s industrial zones remain incomplete, and transport corridors—while improved—still lack the seamless integration seen in ASEAN.
Export‑processing capacity: the missing middle
China’s export‑processing zones are legendary for their efficiency. Vietnam has replicated the model with surprising speed, offering:
- 24/7 customs
- Integrated bonded warehouses
- Fast‑track approvals
Pakistan’s export‑processing zones (EPZs), by contrast, are small, bureaucratic, and under‑utilised. Processing times are slower, and regulatory exemptions are narrower. Investors seeking speed—especially in electronics, garments, and auto parts—prefer environments where paperwork does not outlive the product cycle.
FDI flows: following the path of least resistance
FDI follows predictability. ASEAN economies have become top destinations for Chinese manufacturing FDI, driven by tariff arbitrage and supply‑chain diversification. Vietnam, Malaysia, and Indonesia now attract billions annually.
Pakistan’s FDI inflows, meanwhile, remain modest. Tariff‑driven trade diversion may offer temporary relief—analysts note that US tariffs on Bangladesh, Vietnam, and China could redirect some trade toward Pakistan—but such shifts are opportunistic, not structural.
Investors want ecosystems, not episodes.
Geopolitics: a double‑edged sword
Pakistan’s strategic alignment with China is both an asset and a liability. On one hand, it offers access to Chinese capital, technology, and supply‑chain integration. On the other, it exposes Pakistan to geopolitical risk premiums—especially in Western markets wary of Chinese value‑chain entanglement.
Vietnam, by contrast, has mastered the art of being everyone’s friend and no one’s satellite. Bangladesh has positioned itself as politically neutral and commercially predictable.
Pakistan’s foreign‑policy posture, while improving, still carries perceived volatility.
Can Pakistan capture the opportunity?
The short answer: yes, but only if it fixes reliability.
Pakistan does not need to match China’s scale or Vietnam’s efficiency. It needs to offer a credible alternative for specific industries:
- Textiles and apparel
- Leather and footwear
- Light engineering
- Home appliances
- Auto parts
- Low‑to‑mid‑tech assembly
But credibility requires reforms in five areas:
- Energy reliability — uninterrupted power at competitive tariffs.
- Industrial land readiness — plug‑and‑play zones, not promises.
- Logistics modernisation — faster ports, digitised customs, integrated corridors.
- Labour productivity — vocational training aligned with industry needs.
- Regulatory predictability — stable policies, fewer surprises.
Without these, Pakistan will remain a spectator in Asia’s manufacturing reshuffle.
A forward‑looking verdict
The global manufacturing map is redrawing itself. China’s shift is real; ASEAN’s rise is undeniable; Bangladesh’s discipline is instructive. Pakistan has the ingredients for competitiveness but lacks the consistency investors crave.
If Pakistan can deliver reliability—of power, policy, and process—it could capture a meaningful share of the China+1 wave. If not, the country risks watching yet another industrial revolution pass by, waving politely from the sidelines.
Data Highlights Table
| Indicator | Pakistan | China | Vietnam | Bangladesh | ASEAN Avg |
|---|---|---|---|---|---|
| Industrial land cost ($/sqm) | 30–60 | 120–300 | 100–150 | 50–90 | 80–200 |
| Electricity tariff ($/kWh) | 0.14–0.18 | 0.08–0.12 | 0.08–0.10 | ~0.09 | 0.08–0.12 |
| Monthly manufacturing wage ($) | 150–170 | 600+ | 250–300 | 120–150 | 250–400 |
| LPI score (0–5) | ~2.4 | ~3.6 | ~3.3 | ~2.6 | ~3.0 |
| FDI inflows (manufacturing) | Low | Very high | High | Moderate | High |
| Export‑processing efficiency | Low | Very high | High | Moderate | High |
Some contextual insights informed by search results on tariff‑driven diversification and ASEAN’s FDI surge.


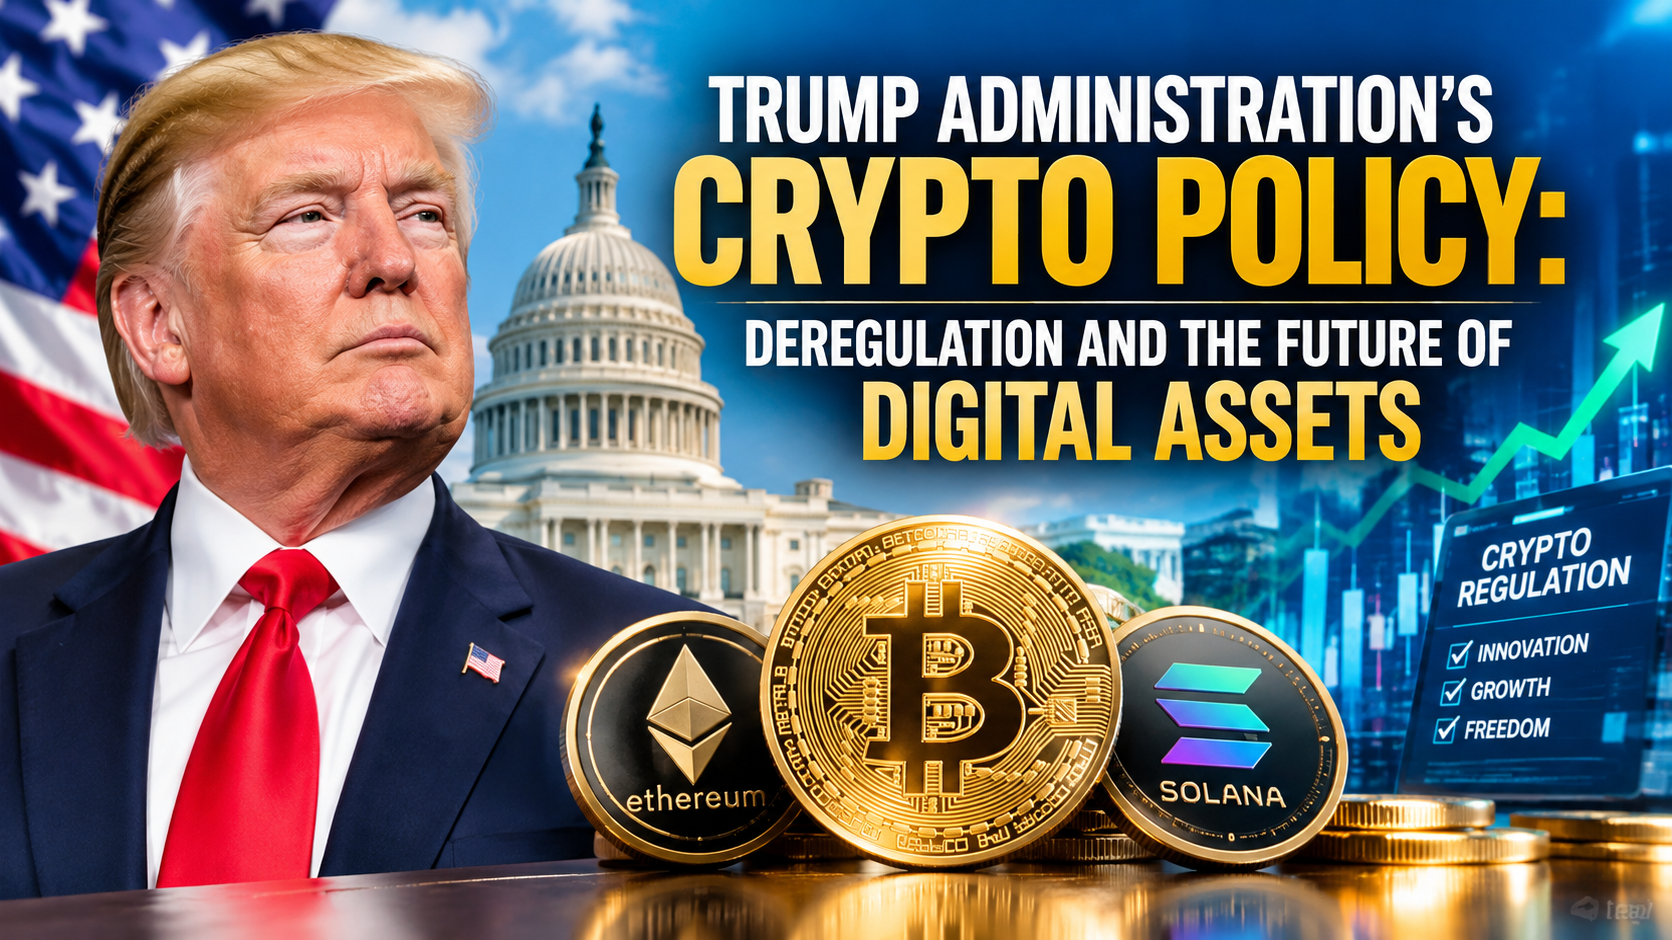
In under two years, the regulatory posture toward crypto in the United States has flipped from adversarial to explicitly promotional. What began as an executive order in January 2025 has cascaded into a stablecoin law, a coordinated SEC-CFTC framework, a five-category classification system for digital assets, and — as of this week — a genuine test of whether Congress can finish the job with comprehensive market-structure legislation. Here is the full architecture of Trump-era crypto policy as it stands in September 2026.
The Foundation: Executive Order 14178 and the White House Report
The administration’s crypto agenda traces back to Executive Order 14178, issued at the start of the second Trump term. On July 30, 2025, the President’s Working Group on Digital Asset Markets — established under that order — issued a comprehensive report titled “Strengthening American Leadership in Digital Financial Technology,” according to Practical Law’s coverage. That report became the blueprint both the SEC and CFTC would spend the next year implementing.
SEC’s “Project Crypto” and CFTC’s “Crypto Sprint”
Within 48 hours of the White House report’s release, both major regulators launched dedicated initiatives. SEC Chair Paul Atkins announced “Project Crypto” on July 31, 2025 — an agency-wide effort to implement the White House’s recommendations, with five stated priorities including, notably, “onshoring crypto to the US,” per Practical Law. Chair Atkins directed the SEC’s policy divisions to coordinate with the agency’s Crypto Task Force, led by Commissioner Hester Peirce, a longtime industry-friendly voice at the Commission.
The very next day, then-Acting CFTC Chair Caroline Pham launched a parallel “Crypto Sprint,” a 12-month initiative covering the listing of spot digital assets on CFTC-registered exchanges, allowing derivatives market participants to use tokenized collateral including stablecoins, and establishing a “CEO Innovation Council” of 12 exchange executives, according to K&L Gates. Within months, the CFTC confirmed spot digital assets were available for trading on a CFTC-registered exchange for the first time.
The GENIUS Act: America’s First Federal Stablecoin Law
The most concrete legislative achievement of the period has been the GENIUS Act, the first U.S. federal law specifically governing stablecoins. Its enactment triggered a wave of follow-on rulemaking: K&L Gates noted that the Treasury Department, the Office of the Comptroller of the Currency, and other federal banking agencies all opened rulemakings to implement the law during 2026. The GENIUS Act’s definition of “digital asset” has since become the template other agencies build from — the SEC’s own proposed crypto-asset offering rules explicitly mirror the GENIUS Act’s definitional language.
March 2026: The SEC-CFTC Coordination Breakthrough
The most significant structural shift arrived in March 2026. On March 11, SEC Chairman Paul Atkins and CFTC Chairman Michael Selig signed a Memorandum of Understanding to formally coordinate the two agencies’ historically overlapping and often conflicting jurisdiction over digital assets, according to Latham & Watkins’ policy tracker. The MOU commits both agencies to a “minimum effective dose” of regulation intended to promote innovation while still protecting market integrity.
Six days later, on March 17, 2026, the SEC and CFTC jointly published an interpretive release — their first major coordinated statement since the MOU — sorting digital assets into a five-category framework, according to Holland & Knight: digital commodities, digital collectibles, digital tools, payment stablecoins (aligned with the GENIUS Act definition), and a fifth category covering more traditional securities-like tokens. That classification system is now the reference point nearly every subsequent rulemaking builds from.
Trump-era crypto policy timeline:
| Date | Development | Body |
|---|---|---|
| Jan 2025 | Executive Order 14178 | White House |
| Jul 30, 2025 | Digital asset policy report | Presidential Working Group |
| Jul 31, 2025 | “Project Crypto” launched | SEC (Chair Atkins) |
| Aug 1, 2025 | “Crypto Sprint” launched | CFTC (Acting Chair Pham) |
| — 2025 | GENIUS Act enacted | Congress |
| Mar 11, 2026 | SEC-CFTC MOU signed | SEC + CFTC |
| Mar 17, 2026 | Five-bucket digital asset classification | SEC + CFTC joint release |
| Aug 2026 | “Regulation Crypto Assets” proposed | SEC |
| Sep 10, 2026 | Revised 630-page CLARITY Act released | Senate Republicans |
| Sep 15, 2026 | Procedural vote scheduled | U.S. Senate |
SEC Proposes “Regulation Crypto Assets”
In August 2026, the SEC moved from interpretation to formal rulemaking, proposing “Regulation Crypto Assets” — a bespoke offering regime specifically for crypto investment contracts. According to Sidley Austin’s analysis, Chairman Atkins said the proposed rules “draw heavily from Congressional work over recent years, particularly the CLARITY Act,” explicitly designing the rule to give the industry a regulatory head start pending final legislation. The proposal’s four-year window for a startup exemption mirrors the CLARITY Act’s own timeline for a token project to reach “mature blockchain system” status — a deliberate signal that the SEC expects the legislative and regulatory tracks to converge.
The Unfinished Business: CLARITY Act’s Uncertain Fate
Despite the extensive regulatory groundwork, the industry’s top legislative priority — the Digital Asset Market CLARITY Act, which would legislatively divide SEC/CFTC jurisdiction and create a comprehensive market-structure framework — remains unpassed as of this writing. The House passed its version, but the bill has stalled in the Senate, falling short of the 60 votes needed for passage, according to Holland & Knight.
Senate Republicans released a substantially revised, 630-page version of the bill on September 10, 2026, adding over 100 changes and specifically targeting “decentralized-in-name-only” protocols by requiring them to register with the CFTC, per Investing News Network. A pivotal procedural vote is scheduled for September 15, 2026, after the Senate returns from recess — but the bill already missed one legislative window in August, and CNBC reported that industry insiders, including SALT CEO John Darsie, remain skeptical of passage in 2026 given the difficulty of moving major legislation heading into midterm elections.
What Happens If CLARITY Fails
Crucially, the industry’s regulatory position does not collapse if CLARITY dies in the Senate. As CNBC’s reporting notes, “viewed from a narrow lens, the investment is already paying off, even if Clarity dies” — the SEC and CFTC have already built out much of the practical framework administratively through the MOU, the joint interpretive release, and the proposed Regulation Crypto Assets rule. Legislation would lock the framework into statute, providing durability against a future administration reversing course, but its absence would not undo the deregulatory shift already underway across every major digital-asset regulator, including the Office of the Comptroller of the Currency, which has also moved toward a looser supervisory framework for bank involvement in digital assets.
Final Verdict
The second Trump administration’s crypto policy has been unusually coordinated and fast-moving by regulatory standards: an executive order, a detailed policy report, twin agency initiatives, the first federal stablecoin law, an inter-agency MOU, a joint classification framework, and now a formal rulemaking — all within about 18 months. The remaining variable is whether Congress can convert that administrative groundwork into durable statute via the CLARITY Act, and the September 15 Senate vote is the clearest near-term test of that question. Either outcome, the substantive deregulatory shift toward “onshoring crypto to the US” is already largely in place at the regulatory level — legislation would cement it, not create it.
Barclays reported second-quarter income of £8.3 billion, up £1.2 billion from a year earlier, and upgraded its full-year 2026 income target even as operating expenses climbed 7% year-on-year — a mixed but ultimately reassuring signal for UK banking-sector health as the country navigates elevated gilt yields and a new premiership.
Income Growth Outpaces a Rise in Costs
Barclays reported second-quarter operating expenses of £4.5 billion, up 7% year-on-year, which the bank attributed to business growth, inflation, and increased investment spending, according to CNBC’s markets coverage. Despite the cost increase, income rose to £8.3 billion, and adjusted earnings per share beat Wall Street consensus, prompting shares to initially react positively before falling more than 7% amid broader market volatility on the results day.
Group Chief Executive C.S. Venkatakrishnan struck a confident tone on the outlook, saying the bank was upgrading its 2026 Group income target to approximately £31.5 billion and remained committed to delivering all financial and distribution targets through 2028, according to the same CNBC report.
Why the Results Matter Beyond Barclays
The results land at a delicate moment for UK financial markets more broadly. Ten-year gilt yields have been trading near 5% amid uncertainty over new Prime Minister Andy Burnham’s fiscal programme, while 30-year yields — sensitive to long-term fiscal credibility — have hovered near multi-year highs. A major UK bank posting income growth and raising its full-year guidance amid that backdrop offers a data point suggesting the underlying corporate and consumer credit environment remains healthier than the gilt market’s elevated risk pricing might suggest on its own.
Context: A Resilient Consumer Backdrop
Barclays’ results also arrive alongside broader UK data that has surprised to the upside. UK retail sales rose 1% in June against expectations for a 0.3% decline, while consumer confidence climbed to a six-month high in July, supported by warmer weather and a spending lift tied to the football World Cup — trends that plausibly support the credit and transaction-fee income underpinning Barclays’ income beat. Annual consumer price inflation, meanwhile, slowed to a 15-month low of 2.6% in June, giving the Bank of England room to hold interest rates steady at its policy meeting this week.
The Cost Pressure Story Isn’t Unique to Barclays
The 7% rise in Barclays’ operating expenses reflects a broader pattern across UK banking: inflation-driven wage costs, continued investment in technology and compliance infrastructure, and the general cost of doing business in a higher-rate environment. How rival UK lenders navigate the same pressures in their own upcoming results will be a key signal of whether Barclays’ income upgrade reflects bank-specific execution strength or a sector-wide tailwind from resilient consumer activity.
What to Watch
Barclays’ upgraded £31.5 billion income target sets a clear benchmark against which the rest of 2026 results will be measured, while the sustainability of the current cost growth rate — set against a Bank of England policy backdrop still calibrated around inflation risk — will determine whether margin expansion continues into 2027. Investors will also be watching how the bank’s guidance holds up if gilt-market volatility around the new government’s fiscal plans intensifies.
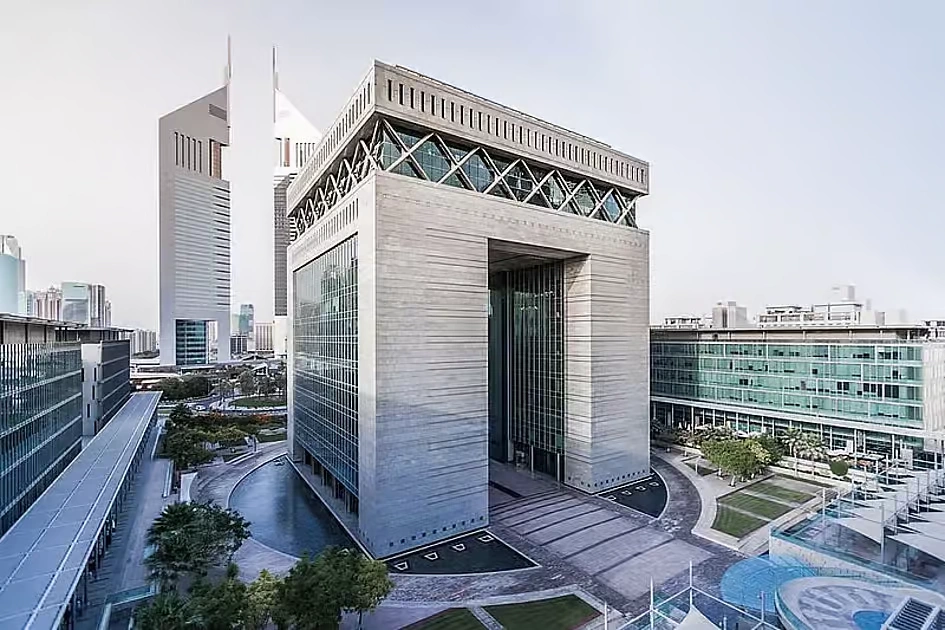
Dubai has climbed to its highest position ever on one of finance’s most closely watched rankings, and the achievement is no accident — it is the direct output of a decade-long, numerically explicit government strategy that few other financial centres have attempted to execute with this level of precision.
The Ranking Itself
The Dubai International Financial Centre has recorded its highest-ever position on the Global Financial Centres Index at seventh place worldwide, the highest ranking ever achieved by any financial centre across the Middle East, Africa and South Asia region, and the only MEASA-region centre to feature in the global top 20 — underscoring both its regional dominance and genuine global competitiveness.
The D33 Strategy Behind the Number
The ranking is explicitly tied to Dubai’s own stated ambitions. The GFCI result is described as pivotal to Dubai’s goal of becoming one of the world’s top four financial centres by 2033, in line with the Dubai Economic Agenda, or D33, which targets a doubling of the emirate’s economy over the decade. Separately, Dubai Chambers has confirmed the plan targets cumulative economic output of AED 32 trillion, or roughly $8.7 trillion, over the decade, supported by 100 transformative projects centred on trade expansion, digital innovation and sustainable growth.
The Underlying Economic Engine
The financial-centre ambitions are backed by genuine current-quarter growth. Dubai’s economy reached AED 232 billion in first-quarter 2026 GDP, a 2.4 percent year-on-year increase, with the finance, construction, healthcare, wholesale and retail trade, and real estate sectors all contributing to the broad-based expansion. Middle East Briefing separately projects the wider UAE economy will expand around 5 percent in 2026, with local banks positioned to increase lending both domestically — supporting SMEs, consumers and project finance — and across borders into markets like Saudi Arabia, where UAE banks’ comparatively lower interbank rates create an arbitrage opportunity.
Real Money Behind the Ranking
The GFCI climb is being validated by tangible transaction volume rather than sentiment alone. Weekly UAE business tracking shows a steady drumbeat of institutional activity: Sharjah Islamic Bank reported AED 803.9 million in net profit, up 15.3 percent, ADI Chain secured a $50 million investment to build sovereign digital infrastructure, and Capital.com reported $1.1 trillion in second-quarter trading volume routed through the jurisdiction. Separately, UAE and Saudi banks are projected to lead GCC credit growth in 2026, reinforcing Dubai and Abu Dhabi’s combined position as the region’s default financial gateway.
Why This Matters for Pakistan and South Asia
Dubai’s ascent as a financial hub carries direct relevance for Pakistan, where — as detailed in our companion coverage of Pakistan’s remittance exposure — roughly 55 percent of the country’s substantial remittance inflows originate from the Gulf Cooperation Council. A deepening, increasingly sophisticated DIFC-anchored financial ecosystem in Dubai means more efficient, lower-cost channels for that capital, alongside growing opportunities for Pakistani and South Asian firms to access GCC-sourced project finance and cross-border credit as UAE banks expand lending beyond their domestic market.
What is Dubai’s global financial centre ranking in 2026?
Dubai’s DIFC recorded its highest-ever ranking on the Global Financial Centres Index at 7th place worldwide in 2026 — the highest ever achieved by any Middle East, Africa or South Asia financial centre — as part of its stated goal to become a top-four global financial hub by 2033.
The Risk Beneath the Growth Story
Not every signal points to unambiguous strength. AGBI’s own reporting notes that UAE banks’ second-quarter results are likely to show weaker profits, slower lending and narrower margins, even as analysts characterise the underlying sector as fundamentally resilient — a reminder that Dubai’s financial-hub ambitions are being pursued against a genuinely more difficult regional operating environment shaped by the Strait of Hormuz disruption and broader Gulf security concerns, not in isolation from them.
The Bottom Line
Dubai’s climb to seventh in the GFCI rankings is less a one-off achievement than a measurable checkpoint on an explicitly numbered, decade-long strategic roadmap — one increasingly backed by real GDP growth, credit expansion, and institutional trading volume rather than ambition alone.

Diesel Prices 2026–2027: Why Cheaper Crude May Not Mean Cheap Fuel

2027 Social Security COLA: Key Details and Dates

KSE-100 Sees Major Drop Post-SBP Rate Hike

Big Tech’s AI Spending Test: Can Revenue Catch Up With Capital Expenditure?

AI Infrastructure Investment Strategies for 2026

Pakistan Freelancers Tax 2026: Payments, Documentation and Formal Growth

Strait of Hormuz Crisis: What the Latest Tanker Attacks Mean for Oil, Shipping and Global Trade

AI Customer Service in 2026: What’s Working, What’s Failing, and What to Buy

Open a Savings Account Online: How to Actually Earn 10x the National Average Rate

Global Housing Market 2026: Where Prices Rise, Where They Don’t

PSX and KSE-100 Record Highs: An Insider’s Guide to Pakistan Stocks

So Delicious Dessert Recall: Affected Products, FDA Guidelines, and Consumer Action

Pakistan’s Current Account Deficit Narrows Sharply to $98 Million in August 2026

Japan Eyes 3.5% Defense Spending: What It Means for Bonds, Stocks, and the BOJ

Top 15 Stocks for Investment in 2026 in PSX: Your Complete Guide to Pakistan’s Best Investment Opportunities
Top 15 Stocks for Investment in 2026 in PSX: Your Complete Guide to Pakistan’s Best Investment Opportunities

Debunking IMF Program Myths: Reconfiguring Engagement for True National Ownership in a Volatile World

Top 10 Mutual Fund Managers in Pakistan for Investment in 2026: A Comprehensive Guide for Optimal Returns

China’s 50% Domestic Equipment Rule: The Semiconductor Mandate Reshaping Global Tech

What the U.S. Attack on Venezuela Could Mean for Oil and Canadian Crude Exports: The Economic Impact

15 Most Lucrative Sectors for Investment in Pakistan: A 2025 Data-Driven Analysis

Pakistan’s Export Goldmine: 10 Game-Changing Markets Where Pakistani Businesses Are Winning Big in 2025

How to Become an Active Taxpayer on Pakistan’s FBR Active Taxpayer List (ATL) in 2026: A Step-by-Step Guide

Pakistan’s Stock Market Renaissance: How 2025’s Hottest Investment Opportunity Is Democratizing Wealth—A Complete Beginner’s Guide

Best Investments in Pakistan 2026: Top 10 Low-Price Shares and Long-Term Picks for the PSX
15 Most Lucrative Sectors for Investment in Pakistan: A 2025 Data-Driven Analysis
15 Most Lucrative Sectors for Investment in Pakistan: A 2025 Data-Driven Analysis

Pakistan’s Economic Outlook 2025: Between Stabilization and the Shadow of Stagnation
-
 Markets & Finance10 months ago
Top 15 Stocks for Investment in 2026 in PSX: Your Complete Guide to Pakistan’s Best Investment Opportunities
-
Markets & Finance10 months ago
Top 15 Stocks for Investment in 2026 in PSX: Your Complete Guide to Pakistan’s Best Investment Opportunities
-
 Analysis9 months ago
Debunking IMF Program Myths: Reconfiguring Engagement for True National Ownership in a Volatile World
-
 Investment10 months ago
Top 10 Mutual Fund Managers in Pakistan for Investment in 2026: A Comprehensive Guide for Optimal Returns
-
 Asia10 months ago
China’s 50% Domestic Equipment Rule: The Semiconductor Mandate Reshaping Global Tech
-
 Global Economy10 months ago
What the U.S. Attack on Venezuela Could Mean for Oil and Canadian Crude Exports: The Economic Impact
-
 AI11 months ago
15 Most Lucrative Sectors for Investment in Pakistan: A 2025 Data-Driven Analysis
-
 Exports11 months ago
Pakistan’s Export Goldmine: 10 Game-Changing Markets Where Pakistani Businesses Are Winning Big in 2025