
Markets & Finance
KSE-100 Plunges Amid Geopolitical Firestorm — But Islamabad Holds the World’s Attention

Trump’s Kharg Island threat, oil at $116, and the Strait of Hormuz crisis send PSX into freefall — even as Pakistan’s capital quietly attempts to rewrite the region’s fate
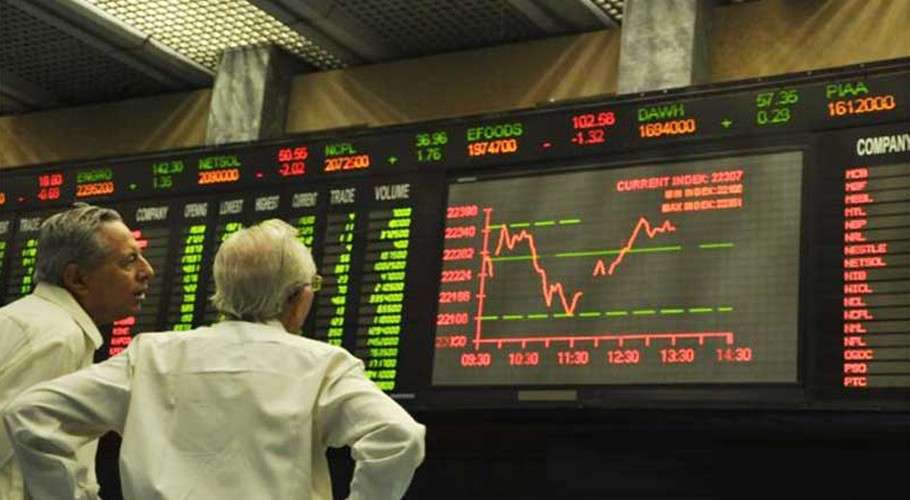
The trading floor in Karachi looked, in the first minutes of Monday’s session, like a room in which all the oxygen had been removed. From the opening bell, the Pakistan Stock Exchange’s benchmark KSE-100 index plummeted over 3,700 points — a drop of nearly 2.5% in less than an hour — as investors absorbed a weekend of extraordinary geopolitical turbulence: oil prices breaching $116 a barrel, a US president musing publicly about seizing Iran’s most critical export hub, and Yemen’s Houthis entering the conflict with fresh missile salvos against Israel. By 9:40am, the KSE-100 had fallen to 147,950.31 points from a previous close of 151,707.51, touching the lowest intraday reading in the index’s 52-week history. Every major sector bled red.
The KSE-100 drops over 3% — and this episode is not occurring in isolation. It is the latest chapter in a five-week global energy crisis that has repriced risk from Houston to Hong Kong, and which now casts a particularly long shadow over Pakistan: a major oil-importing economy whose current account, currency, and inflation trajectory hang in direct tension with every dollar added to the price of Brent crude. What makes today’s session historically distinctive is not simply the severity of the sell-off, but its simultaneous backdrop: even as Karachi’s market bled, barely 1,500 kilometres away in Islamabad, Pakistan’s diplomatic corps was hosting the world’s most consequential attempt yet to end the war that is causing it.
A Market Under Siege: What Happened and Why
Intense selling pressure gripped the Pakistan Stock Exchange on Monday as the KSE-100 index dropped over 3,700 points in early trading, driven by escalating tensions in the Middle East and fears of a prolonged conflict. Bloom Pakistan The rout was broad and unsparing. Selling pressure was particularly concentrated in the automotive, cement, banking, oil and gas, power, and refinery sectors, with shares of major companies including ARL, HUBCO, MARI, OGDC, PPL, HBL, MEBL, MCB, and NBP trading in the negative zone. Bloom Pakistan
The immediate macroeconomic trigger is unmistakable. Brent crude, the global oil benchmark, crossed $116.5 a barrel on Monday before paring to around $114.6 — still 1.8% up on the day — while WTI, the US benchmark, climbed 1% to around $101 a barrel. CNN That price tag carries existential weight for Pakistan, which imports virtually all of its petroleum needs and where energy subsidies already strain a budget operating under the watchful eye of the International Monetary Fund. Crude oil prices have surged more than 50% so far in March following the US-Israeli war against Iran, with Brent having traded around $73 a barrel before the United States and Israel attacked Iran on February 28, prompting Tehran to choke off the Strait of Hormuz. CNN
The rupee, notably, held steady. The USD/PKR exchange rate was around 279.09 on March 30, marginally lower from the previous session, TRADING ECONOMICS suggesting institutional confidence in the State Bank’s management of external reserves — for now. Bond yields, too, showed no alarm. This divergence between equity panic and macro stability is itself revealing: the sell-off is primarily a sentiment shock rather than a deterioration in Pakistan’s fundamentals. That distinction, however cold a comfort to investors nursing heavy losses, matters enormously for the medium-term outlook.
Trump’s Kharg Island Gambit — and the $116 Oil Question
If one man can be credited with Monday’s carnage, his name requires no introduction. Trump told the Financial Times in an interview published Sunday that he wants to “take the oil in Iran” and could seize Kharg Island, which handles about 90% of the country’s oil exports, comparing the potential move to US operations in Venezuela. CNN He then escalated further in the early hours of Monday. The president warned on Truth Social that the US would “completely obliterate” Iran’s electric generating plants, oil wells and Kharg Island if the strategically vital Strait of Hormuz was not “immediately” reopened and a peace deal not reached “shortly.” CNBC
The market implications of such rhetoric are immediately quantifiable. Goldman Sachs estimates a $14–18 per barrel geopolitical risk premium baked into current oil prices, TECHi® while Macquarie Group warned last week that Brent crude could reach $200 a barrel if the war continues until the end of June, equating to a US gasoline price of $7 per gallon. CNN For Pakistan, every $10 rise in sustained crude prices adds approximately $2–2.5 billion to the annual import bill — a structural pressure that threatens to widen the current account deficit, erode foreign reserves, and potentially force the State Bank to revise its monetary easing trajectory.
Michael Haigh, global head of fixed income and commodities research at Société Générale, warned that the potential for further disruption through the Bab el-Mandeb Strait — linking the Gulf of Aden to the Red Sea — could push prices even higher, noting that “four to five million barrels per day” transit the waterway. CNBC In a scenario where both chokepoints are disrupted simultaneously, the oil shock hitting Asia’s emerging markets would be unprecedented in the post-2008 era.
Today’s Damage: Sector-by-Sector Breakdown
| Sector | Impact | Notable Names |
|---|---|---|
| Oil & Gas | Heavy selling | OGDC, PPL, MARI |
| Commercial Banks | Largest negative index contribution | HBL, MCB, NBP, MEBL |
| Cement | Broad-based losses | LUCK |
| Power / IPPs | Negative zone | HUBCO |
| Automotive | Under pressure | ARL |
| Refineries | Sharp declines | ARL |
| Volume Leaders (Overall) | High retail activity | KEL, FNEL, WTL |
Sources: PSX Data Portal, Bloom Pakistan, DayNews.tv — March 30, 2026
Islamabad: The Diplomatic Counterweight
Here is where the story acquires its most remarkable dimension. While Karachi’s brokers scrambled to offload positions, diplomats in Islamabad were doing the opposite — attempting to arrest the very geopolitical spiral that was causing the panic. Two-day consultations of foreign ministers of Türkiye, Saudi Arabia, Egypt and Pakistan started in Islamabad on Sunday as the capital turned into the centre of a rapidly forming diplomatic track — described by officials as the most coordinated regional effort yet to push the United States and Iran towards direct talks. Al Jazeera
The outcome was more concrete than many had anticipated. Pakistan achieved a significant diplomatic success as Saudi Arabia, Türkiye and Egypt endorsed Islamabad’s growing role as a mediator for peace, backing Pakistan’s initiative to promote de-escalation and potentially host talks between the United States and Iran. The Nation Foreign Minister Ishaq Dar announced: “Pakistan is very happy that both Iran and the US have expressed their confidence in Pakistan to facilitate their talks. Pakistan will be honored to host and facilitate meaningful talks between the two sides in coming days for a comprehensive settlement of the ongoing conflict.” Bloomberg
That language carries weight well beyond the ceremonial. Diplomats say that if current contacts hold, talks between US Secretary of State Marco Rubio and Iran’s Foreign Minister Abbas Araghchi could take place within days, potentially in Pakistan. Al Jazeera Germany’s Foreign Minister Johann Wadephul had already telegraphed optimism, saying he expected a direct US-Iran meeting in Pakistan “very soon.” Al Arabiya
The institutional infrastructure is also being built. The four foreign ministers agreed to establish a committee of senior officials tasked with developing modalities for sustained coordination among Pakistan, Saudi Arabia, Türkiye and Egypt The Nation — a formalised mechanism that gives this diplomatic initiative permanence beyond the current crisis.
Crucially, Pakistan’s leverage derives not from military power but from its unique geographic and diplomatic positioning. Islamabad has longstanding links with Tehran and close contacts in the Gulf, while Prime Minister Shehbaz Sharif and Army Chief Field Marshal Asim Munir have struck up a personal rapport with US President Donald Trump. Tehran has refused to admit to holding official talks with Washington but has passed a response to Trump’s 15-point plan to end the war via Islamabad. Bangladesh Sangbad Sangstha
The Strait of Hormuz: Pakistan’s Lifeline and Geopolitical Card
No development more elegantly illustrates Pakistan’s pivotal position than what happened over the weekend. Pakistan announced that Iran would allow 20 of its flagged ships to pass through the Strait of Hormuz — two ships daily — with Foreign Minister Dar calling it “a welcome and constructive gesture by Iran.” CNN Trump himself acknowledged the development, with the US president telling reporters that Iran had “allowed 20 boats laden with oil to go through the Strait of Hormuz, out of a sign of respect.” CNN
This seemingly modest concession — 20 vessels in a waterway that once carried 17.8 million barrels per day — is diplomatically seismic. It signals that Tehran views Islamabad as a credible channel, granting Pakistan a degree of real-time influence over one of the world’s most consequential shipping lanes. For Pakistan’s economy, the reciprocal benefit is potentially substantial: reduced energy costs, greater foreign exchange stability, and a positioning premium as a peace-broker that could attract diplomatic investment and economic goodwill from Gulf partners.
The Strait has been effectively closed to commercial traffic since March 2, with approximately 17.8 million barrels per day of oil flows disrupted. Iran has been operating a yuan-based toll system at the Strait, allowing select Chinese, Russian, and allied vessels to transit while collecting fees in Chinese yuan. TECHi® More ships are passing through the Strait of Hormuz according to shipping data, but still far fewer than before the Middle East conflict erupted. CNN
Global Ripple Effects: Asia First, Then the World
Pakistan is not alone in feeling the tremors. Asia is the first continent to feel the effects of depleting oil stocks, since oil shipments typically reach there first from the Middle East, with Africa and Europe likely to be more impacted by April, a JPMorgan report warned. CNN Tokyo’s equity markets have already registered sharp declines, and the yen is under pressure. In Japan, alarm is sounding over the declining value of the yen, with Vice Finance Minister Atsushi Mimura telling reporters: “We will respond on all fronts.” ITV News
For emerging markets with oil import dependencies — Bangladesh, Sri Lanka, Indonesia, Egypt — the macro arithmetic is equally punishing. Higher oil prices feed directly into inflation, compress central bank policy space, widen current account gaps, and invite currency depreciation. Pakistan, having only recently stabilised after a near-sovereign-debt crisis and IMF bailout, is particularly exposed to this feedback loop. The KSE-100 drops over 3% today are in part a market pricing exercise on exactly this vulnerability.
Brent crude, the international benchmark, has jumped more than 50% since the start of March, surpassing the previous record of 46% during Saddam Hussein’s 1990 invasion of Kuwait. NPR That statistical comparison should sharpen the mind of anyone inclined to treat this as temporary noise.
The Analyst View: Overreaction or Justified Panic?
Seasoned observers of the KSE-100 have been here before — and their verdict is nuanced. The index has now endured a series of geopolitical shocks in rapid succession. On March 2, in the session that followed the initial US-Israeli strikes on Iran, the KSE-100 recorded a plunge of 16,089 points, or 9.57%, its largest single-day fall in the bourse’s history, prompting an automatic market halt after the KSE-30 dropped 5% within the first seven minutes of trading. The Express Tribune
In that session, Topline Securities CEO Mohammed Sohail counselled restraint. “High leverage and overbought positions triggered panic selling,” he observed, adding that the rupee and bond yields remained stable, indicating limited macro impact. “With the market trading at a price-to-earnings ratio of nearly 7x, valuations appear compelling, offering attractive entry points to medium- and long-term investors. If macroeconomic stability persists, the recent sell-off could ultimately prove to be an overreaction,” Sohail said. The Express Tribune
AKD Securities remarked that the KSE-100 overreacted to the Middle East military conflict and expected the index to “stage a recovery as the direct economic impact on Pakistan appears manageable and the country is not a direct party to the conflict.” The Express Tribune
Today’s session carries a similar profile — heightened fear rather than fundamental economic deterioration. The key distinction from March 2’s bloodbath is that this time, Pakistan’s diplomatic positioning has materially improved. The four-nation Islamabad framework, the Hormuz passage concession, and the potential for hosting US-Iran talks all represent real — if fragile — de-escalation optionality that simply did not exist a month ago.
The Outlook: What the Islamabad Diplomatic Track Means for the KSE-100
The PSX’s near-term direction will be determined by two variables operating on very different timescales: oil prices, which respond in real time to rhetoric and battlefield developments; and the diplomatic track, which moves at the pace of sovereign ego and geopolitical calculation.
On the first front, the risk remains decisively to the upside for oil prices. David Roche, strategist at Quantum Strategy, warned that markets are increasingly pricing in the possibility of “boots on the ground” and a move to seize Iran’s key export hub at Kharg Island — a step that would effectively choke off Iran’s dollar revenues but risk triggering full-scale escalation, with Tehran likely to retaliate. CNBC
On the second front, the Islamabad meeting represents the clearest evidence yet that a negotiated off-ramp exists. The four-nation mechanism is not designed to produce a ceasefire itself — its purpose is to align regional positions and prepare the ground for a possible direct US-Iran engagement. If successful, it could provide the political cover both Washington and Tehran need to enter talks without appearing to concede. Al Jazeera
The decisive weeks ahead will test whether Pakistan’s diplomatic capital can be converted into tangible de-escalation — and whether that de-escalation arrives in time to prevent the oil shock from becoming structurally embedded in Pakistan’s economic trajectory. For investors watching the KSE-100, the index is no longer simply a barometer of corporate Pakistan’s health. It has become a live readout of the world’s most consequential diplomatic gamble — one in which Islamabad, improbably, holds a central hand.
The market closed today not in despair, but in watchful, expensive uncertainty. And for an economy that has lived on the edge of crisis for most of the past three years, that is the most honest description of where Pakistan stands: poised, precarious, and pivotal — all at once.


Diesel costs move through refinery capacity, freight and taxes. A crude-oil price decline is only the beginning of the story.
Diesel costs move through refinery capacity, freight and taxes. A crude-oil price decline is only the beginning of the story. This analysis draws on primary documents and contemporaneous reports available on November 6, 2026; subsequent market movements or policy announcements may change the outlook.
Oil markets have experienced a year of extraordinary volatility. The World Bank’s October 2026 Commodity Markets Outlook forecasts a 32% rise in energy prices in 2026 and projects Brent crude averaging $91 a barrel, before an easing to $79 in 2027 under its baseline. Those are annual forecast averages, not today’s diesel price at any particular pump.
The Spanish keyword diésel captures a large international search intent, but an article promising one “global diesel price” would mislead readers. Retail prices vary among countries and even within cities according to taxes, currency movements, refinery access, logistics and the chosen grade. A better question is how oil shocks move into household and freight costs—and why relief can lag.
Crude is not a finished fuel
Refineries process crude into diesel, gasoline, jet fuel and other products. The value of diesel reflects the price of crude plus a refining margin, sometimes called the crack spread, as well as distribution and retail expenses. If a region lacks adequate refinery capacity, diesel can remain scarce and expensive even when global crude prices soften.
Distillate inventories matter particularly for trucks, agriculture, construction and industry. Seasonal heating demand can compete for similar middle-distillate streams. A headline Brent decline therefore needs to be paired with regional wholesale distillate prices before any conclusion about a near-term pump-price change.
Currency and taxes explain national differences.
Oil is commonly priced in U.S. dollars. A weaker local currency can offset a fall in the dollar-denominated crude price. Meanwhile, excise duties, value-added taxes, retail price caps or subsidies can either amplify or suppress changes at the pump. Countries that administer fuel prices may adjust them periodically rather than continuously.
Consider two identical importers with different currencies and tax regimes. Even with the same crude benchmark, their retail fuel prices can move in different directions. Comparisons should specify diesel grade, currency per litre or gallon, tax inclusion and date. Converting units without checking specifications can create false precision.
Freight makes diesel an economy-wide cost.
Commercial trucking and much heavy equipment rely on diesel. Higher operating costs can show up in food distribution, construction, agriculture and delivery fees. The consumer price effect is neither immediate nor one-for-one: companies hedge, absorb costs, redesign routes and negotiate contracts.
The World Bank also projects food-price increases amid conflict-related shipping disruptions and weather threats. Diesel is only one link in that chain. Fertiliser costs, yields, trade restrictions and exchange rates may matter just as much for the ultimate supermarket bill.
What could happen in 2027
The baseline scenario is for some easing in commodity prices if disrupted supplies recover. The adverse scenario is more severe escalation affecting oil infrastructure, trade routes or inventories; the World Bank discusses a possible $105 annual Brent average in 2027 under a combined downside scenario. These are conditional modelling outcomes, not promises.
For households and fleet managers, the useful approach is to budget across a range of fuel costs, monitor local policy changes and avoid locking plans to a single global crude forecast. Energy efficiency, sensible route planning and transparent fuel surcharges can reduce exposure without requiring confident market timing.
What a closer look at the source record shows
The available record supports a useful separation between confirmed developments and interpretation. The first column below identifies the type of evidence; the second explains the analytical use, not an independently measured market statistic.
| Research focus | How it informs this story |
|---|---|
| Confirmed evidence | World Bank October commodity outlook |
| Interpretive opportunity | Explain refined versus crude prices |
| Secondary question | Localize diésel search intent |
| Next verification | For localisation, verify national fuel regulator data for a fixed country and date before publishing any retail price. |
The research priority is relevance rather than sheer citation volume. Repeated references to the same press release do not represent independent confirmation, and authoritative data can support a narrower claim than an ambitious headline suggests. Wherever a numerical fact is used, the source date and stated coverage should travel with it.
How to interpret the evidence without overclaiming
The transmission path has several prices. Crude benchmarks, wholesale distillates, freight costs and retail pump prices are separate observations. Reporting one as if it were another misleads readers. In this article’s subject—2027 diesel prices—that distinction prevents superficially precise figures from becoming misleading conclusions. A credible account should explain exactly which evidence supports each inference and what would change the analysis.
Policy can slow or amplify the pass-through. Taxes, subsidies, market structure and exchange rates influence what consumers actually pay, even when the same global crude benchmark applies. For localization, verify national fuel regulator data for a fixed country and date before publishing any retail price. These checks are important because individual data points can be correct while the story assembled from them is incomplete.
Three specific tests make the coverage stronger:
- Explain refined versus crude prices. Ask what the underlying observation actually measures, which population or companies it covers, and how recent it is. A relevant primary document outweighs a popular unsourced claim.
- Localize diésel search intent. Compare plausible explanations and resist attributing every market or policy movement to one event. When an observed change has several possible causes, explain which are supported and which remain hypotheses.
- Distinguish forecasts from pump quotes. Describe what new fact would falsify the prevailing interpretation. Reporting that cannot be revised in the face of new evidence is advocacy, not analysis.
Three diesel-price paths for 2027
The expected easing reaches refiners. If crude inventories recover and refinery throughput stabilises, wholesale diesel costs could moderate alongside the World Bank’s lower 2027 Brent baseline. The timing would still vary by market. Importers with relatively stable currencies and competitive distribution might see faster retail relief than countries with large currency depreciation or administered price adjustments.
A renewed distillate shortage. Shipping disruption, refinery outages or winter demand could raise diesel premiums independently of the global crude benchmark. Truck fleets and farmers would experience rising costs even if headlines focused on an otherwise stable Brent price. Monitoring wholesale gasoil, stock levels and refinery runs is therefore more useful than projecting pump prices solely from crude futures.
Prices fall unevenly. Some governments might preserve fuel-tax revenue or unwind subsidies as energy markets stabilise. Consumers could then see modest relief while oil exporters face lower export receipts. For Spanish-language coverage of diésel, select a country before quoting a price; Mexico, Spain and South American markets have different policies, currencies and units. A single global figure cannot serve all of them.
A practical research checklist
A reader evaluating this issue should first open the primary sources linked in the article and check their publication dates. Next, identify the specific claim being tested, its units and its geographic or institutional scope. Then compare that evidence with at least one independent account, asking whether the sources are reporting the same underlying data or repeating one another. Finally, distinguish a dated observation from a prediction and note the developments that would demand an update.
For a working editorial desk, this sequence is equally important. A clearly dated article can remain valuable after prices or politics change if its explanations endure and its volatile numbers are identified as snapshots. An article that quietly presents yesterday’s quote as today’s fact, by contrast, loses credibility even when the broader argument is sensible.
Questions readers are asking
Will diesel be cheaper in 2027?
The World Bank projects lower average Brent prices in 2027, but local diesel outcomes depend on refining, taxes, currencies and supply disruptions.
What is the difference between crude and diesel?
Crude oil is a raw input; diesel is a refined product with separate margins, inventories and transport costs.
Why do diesel prices vary by country?
Taxes, subsidies, currencies, refinery supply, fuel specifications and logistics differ widely.
Does the Spanish term diésel change the information needed?
No. The same economics apply, but a useful Spanish-market article requires local prices, units, taxes and sourcing.
The judgment
Diesel costs move through refinery capacity, freight and taxes. A crude-oil price decline is only the beginning of the story. The most responsible conclusion is conditional: For localisation, verify national fuel regulator data for a fixed country and date before publishing any retail price. The argument should evolve when new source material is published, rather than being defended simply because it made a compelling headline on November 6. For readers, the value is a clearer distinction among what has already happened, what remains uncertain and what developments would actually change the decision.
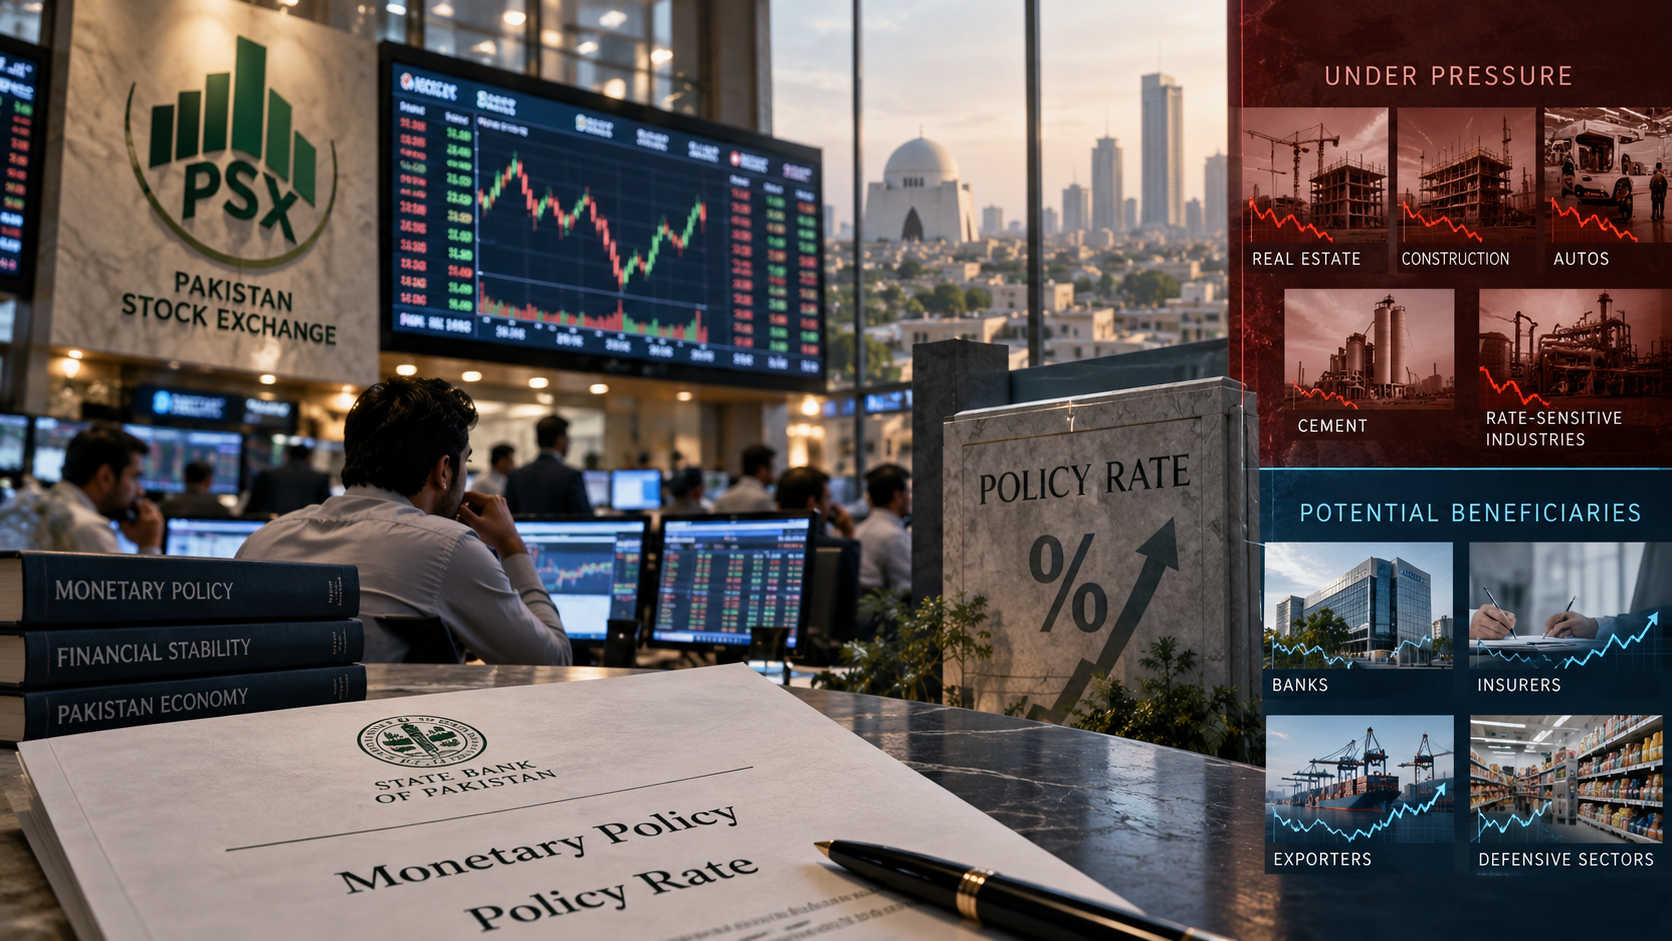
The KSE-100 was weak in the days around the SBP’s 26 October decision. Business Recorder reported the index down more than 800 points in the opening minutes of Monday, at about 161,542, and Tribune had it near 161,660 by midday, an intraday range of roughly 161,250 to 162,488. The Friday before, the index had lost more than 1,300 points as fighting between Saudi Arabia and the Houthis intensified and oil rose. Arif Habib’s head of research, Sana Tawfik, attributed the selling to two things: global weakness on higher oil and caution ahead of the rate decision.
The sectors named in reports were broad: automobile assemblers, cement, commercial banks, oil and gas explorers, oil marketing companies, power generation and refineries. Index heavyweights such as HUBCO, OGDC, MARI, PPL, HBL, MEBL and NBP traded lower at the opening.
The SBP then raised the policy rate by 50 bps to 12%, the first rise since April’s 100 bps move. The post-decision close was not retrieved; check it before publishing.
Why Sectors React Differently
Cement and autos (leveraged, demand-sensitive). Higher borrowing costs raise financing expenses for companies and can dampen private credit and investment. After April’s hike, analysts reported in Tribune that cyclicals such as cement would carry the weight of higher rates.
Commercial banks (mixed). The same April analysis suggested banks could see relative support over the medium term, as higher rates typically widen margins on assets. But banks also sold off in recent sessions, reflecting broader risk-off sentiment and sensitivity to government borrowing costs, so the benefit is not automatic.
Oil and gas explorers and oil marketers (oil-linked). These trade on the oil price and on circular-debt and pricing-policy questions as much as on rates. With Brent near $115, the oil story can outweigh the rate story.
Power producers and refineries. Sensitive to financing costs, energy-pricing decisions and the IMF’s push for timely tariff adjustments.
Fertiliser. Reported among the sectors with selling pressure after April’s hike; gas pricing and input costs matter alongside rates.
What the Hike Means for Valuations
Higher policy rates raise the return investors can earn on risk-free assets, which pushes down the price they will pay for equities. With inflation at 10.26% in September and a policy rate of 12%, the real return on fixed income is modestly positive. That competes with equities for capital, particularly after a strong multi-year run in the index.
Scenarios for the Next Few Weeks
- Oil retreats on a Qatari deal: inflation fears ease, and the market could recover some of the loss. The reply from Iran is due by the end of the week.
- Stalemate: headline-driven trading with sector rotation based on oil sensitivity.
- Escalation or another hike on 14 December: pressure on cyclicals and leveraged names.
These are scenarios, not forecasts.
What Investors Should Check
- Company debt levels and interest coverage (leveraged names are most exposed).
- Exposure to oil prices and government pricing policy.
- Dividend yield versus T-bill and deposit rates.
- Upcoming earnings season commentary on financing costs.
The PSX sold off ahead of a hike that was widely expected. What matters now is whether oil and the Iran talks ease or worsen the inflation outlook, because that, not Monday’s 50 bps, will decide the 14 December MPC and the market’s direction.
Oil Markets
Strait of Hormuz Crisis: What the Latest Tanker Attacks Mean for Oil, Shipping and Global Trade
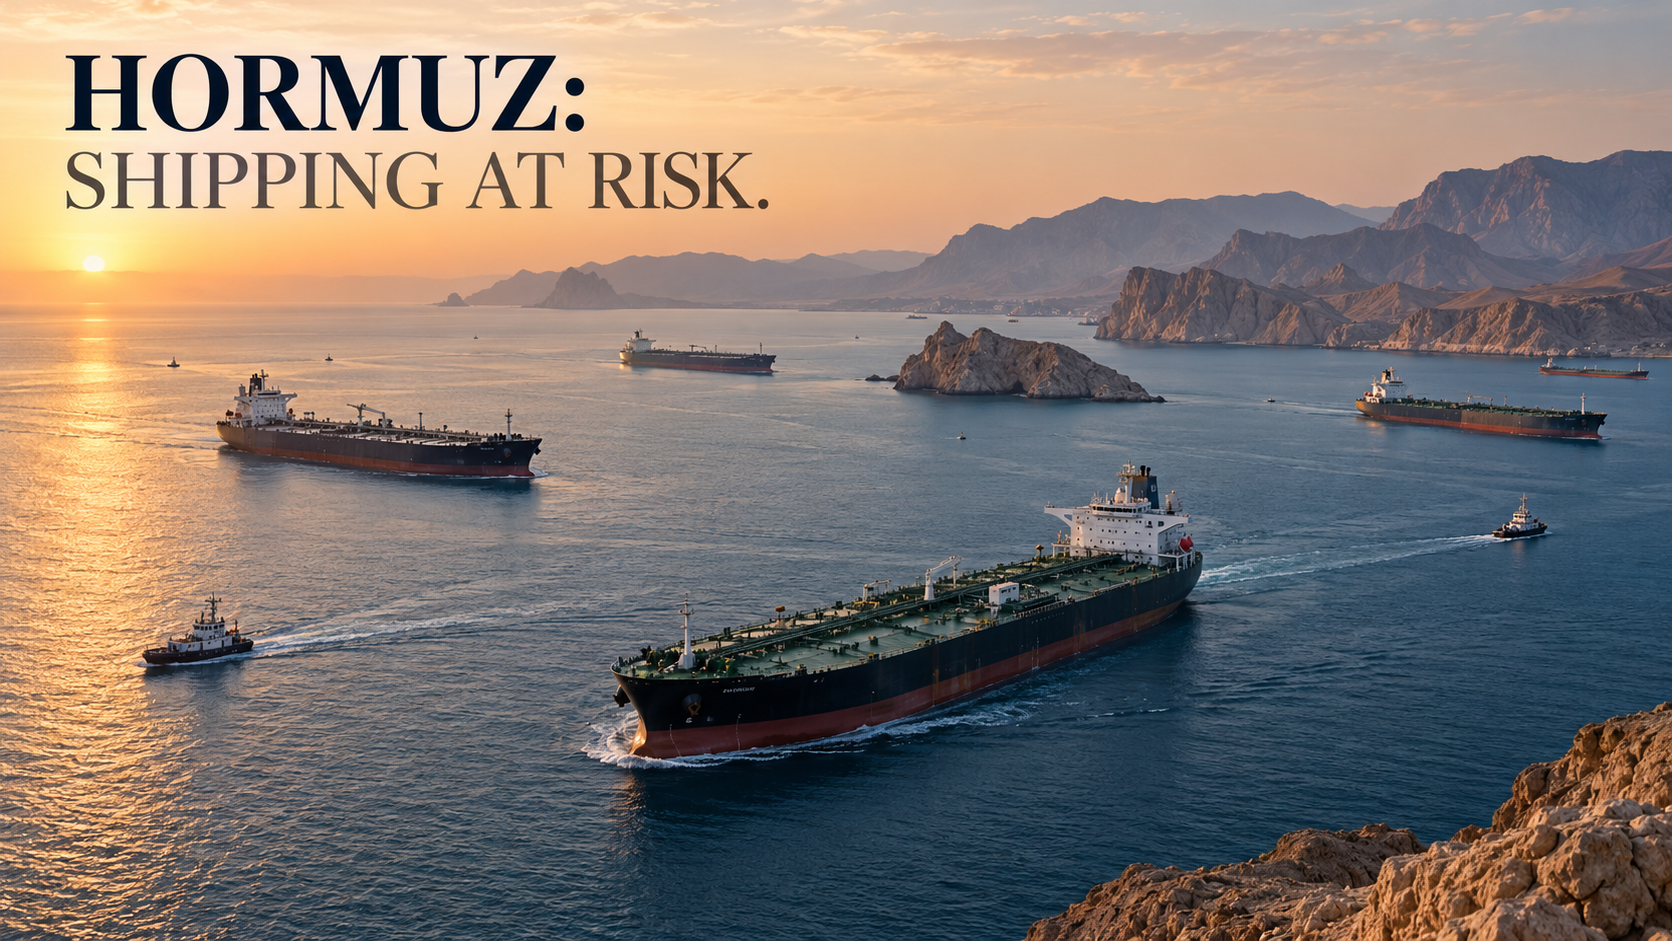
Shipping through the Strait of Hormuz, the narrow passage linking the Persian Gulf with the Gulf of Oman, remains dangerously disrupted after a renewed sequence of attacks on commercial tankers. Data reported by Reuters on October 8 showed commodity-vessel transits falling to their lowest point in more than two months, even as portions of the oil-export system had adapted to months of conflict. The immediate implications extend beyond crude prices: shipping insurance, the security of crews, refined fuels and supply chains all face pressure. Reuters’ October 8 shipping report and Lloyd’s List Intelligence’s maritime assessment provide a grounded view of the disruption.
Key takeaways:
- The strait remains severely restricted for many commercial operators, but “zero shipping” would be inaccurate.
- Recent attacks have increased risk even as some exporters have developed costly workarounds.
- Vessel transits, crude shipments and refined-product deliveries are different measures; they can move in different directions.
- Shipping conditions depend on security, insurance, crew availability, terminals, vessels and routes—not just whether the waterway is physically navigable.
Is the Strait of Hormuz closed?
There is no simple yes-or-no answer. The passage is geographically open water, but military threats and commercial risk have sharply curtailed ordinary shipping. Some vessels continue to transit while others hold back, reroute or operate under exceptional arrangements. A headline declaring a complete physical closure would erase these distinctions.
In the period reviewed by Reuters, Kpler data indicated just seven commodity-vessel passages on Tuesday, October 6, followed by 10 on Wednesday, October 7. Other tracking sources used different vessel definitions and recorded slightly different counts. These figures are snapshots, not an unchanging daily average and not proof that every class of cargo stopped moving.
The conflict’s maritime effects have continued through successive phases in 2026. An earlier understanding enabled some recovery, but the latest attacks illustrate how quickly owners, insurers and captains can reassess risk.
Why Hormuz matters to the global economy
The strait is among the most consequential energy chokepoints because Gulf producers rely on it to reach buyers in Asia and elsewhere. Tanker movements affect crude oil, condensate and petroleum products; liquefied natural gas ships also use the route.
For a sense of scale, the U.S. Energy Information Administration’s 2026 chokepoint analysis estimates average oil flows through Hormuz at 21.6 million barrels per day in the fourth quarter of 2025, compared with 4.9 million barrels per day in the second quarter of 2026. These are quarterly flow estimates, not real-time October readings. They show how significant the early disruption became, but they should not be conflated with current daily transits.
| Metric | Reported observation | What it actually measures |
|---|---|---|
| Hormuz oil flows, Q4 2025 | 21.6 million barrels/day | Quarterly average of crude, condensate and products; EIA |
| Hormuz oil flows, Q2 2026 | 4.9 million barrels/day | Quarterly average following conflict disruption; EIA |
| Commodity vessels, October 6 | 7 passages | Particular-day Kpler vessel observation reported by Reuters |
| Commodity vessels, October 7 | 10 passages | Next-day snapshot, not oil volume |
This illustrates a common mistake in rapidly moving market coverage: a lower ship count does not mechanically mean oil volume declines by the same percentage. Tanker size, load levels, cargo type and alternative export routes matter.
The latest attacks and security assessment
In its October 8 report, Lloyd’s List Intelligence said at least 13 attacks on tankers or gas carriers had been recorded since September 28. The specialist service characterized commercial shipping threats as severe and described continued pressure on the export-recovery network.
The crisis is about the safety of maritime crews as much as it is about the price of oil. A vessel that can technically sail may still lack affordable insurance, an acceptable charter agreement or crew willingness to enter a high-threat area. Owners must consider security advisories, flag and sanctions exposure, the destination of the cargo and possible interruptions on the return voyage.
Financial Times reporting has described attacks extending beyond the narrow waterway, underscoring that an operator’s exposure can continue across surrounding Gulf shipping routes. This is why changing the transit route within a region does not automatically remove the risk.
Why oil flows can recover while shipping stays abnormal
Export systems adapt when normal logistics break down. Cargo can be moved overland where pipelines exist, loaded through alternative ports, consolidated into larger vessels, or transferred between ships. These arrangements can restore some export volumes without recreating pre-crisis shipping conditions.
Lloyd’s List reported 477 non-Iranian-linked transits during September 2026, its highest month since the conflict began, while also noting that workarounds remained costly and concentrated among a relatively small group of operators. That September total and the October daily count are not directly comparable: one is a full-month measure with a specific ship definition, the others are daily snapshots of commodity vessels.
A recovered barrel is not necessarily a recovered route. It may reach its buyer after longer sailing time, additional handling, higher freight charges and elevated security costs. That extra complexity is economically important even if headline export tonnage appears healthier.
Insurance as a second chokepoint
War-risk coverage is a critical commercial constraint. Insurers assess the likelihood of a vessel being damaged, detained or unable to complete its voyage. Owners and charterers must decide whether premiums and contract terms are acceptable. A large increase in required coverage can deter normal cargo movements even where navigation remains physically possible.
Changing conditions also complicate freight pricing. Tanker availability may be constrained if vessels are stuck, diverted or committed to long journeys. Higher tanker day rates and delays can feed into delivered energy costs independent of the benchmark price of crude.
Implications for oil prices, diesel and LNG
Crude oil prices reflect both immediate supply and expectations about future supply. A security incident can raise risk premiums before cargo volumes fall. Conversely, an announcement suggesting lower tension can reduce futures prices without instantly reopening commercial routes.
Refined petroleum products are a separate problem. Gasoline, diesel and jet fuel depend on refinery operations, product-specific export terminals, storage and specialized trading networks. Even when crude output rebounds, damaged or curtailed refinery operations can keep particular fuels scarce. The EIA’s July 2026 analysis described how Middle East disruptions changed petroleum-product sourcing and strengthened refining margins in some other markets.
LNG adds another layer. Gas shipments operate with their own contracts, terminal capacity and vessel availability. An oil-volume recovery does not necessarily describe the state of gas markets.
What should businesses watch next?
Instead of relying on a single dramatic headline, an energy buyer or logistics manager should monitor the following signals together:
- Security incidents: independently confirmed vessel strikes and official maritime risk notices.
- Physical passages: comparable daily and weekly vessel counts using consistent definitions.
- Commodity throughput: crude, refined products and gas separately, not one blended total.
- Freight and insurance: costs of obtaining transportation and coverage for the route.
- Alternative routes: operational pipeline and port capacity, not merely theoretical map distances.
- Refinery status: the availability of usable finished fuels, especially diesel and jet fuel.
Political announcements also matter, but market conditions are shaped by whether ships actually sail and cargo reaches buyers.
Frequently asked questions
Where is the Strait of Hormuz?
It lies between Iran to the north and Oman and the United Arab Emirates region to the south, linking the Persian Gulf with the Gulf of Oman and the Arabian Sea.
Is any shipping still getting through?
Yes. Reuters and Lloyd’s List reported continued, restricted vessel traffic during October 2026. A full shutdown of every vessel would misrepresent these observations.
Why are ship counts and barrels per day different?
Ships vary in size, type and how fully they are loaded. Some vessels transport crude, others products or gas. A transit count and an oil-volume estimate answer different questions.
Does a rise in crude exports mean the crisis is over?
No. Alternative routing, increased insurance costs and attacks can persist even when headline crude export volumes improve.
Which countries face the greatest exposure?
Gulf producers and energy-importing economies are directly exposed, but freight costs, energy prices and financial-market volatility can transmit effects globally.
What should readers trust when forecasts conflict?
Prefer clearly dated EIA data, Reuters reporting and specialist Lloyd’s List methodology. Check both the underlying date and the definition of a transit.
Bottom line
Hormuz is not just a map location. It is a chain of commercial decisions shaped by security, insurance, shipping capacity and energy infrastructure. The October attacks demonstrate how an apparent recovery in some cargo flows can coexist with an intensely risky transportation environment. The most useful reporting separates what has been verified today from historical context and what could happen next.

Diesel Prices 2026–2027: Why Cheaper Crude May Not Mean Cheap Fuel

2027 Social Security COLA: Key Details and Dates

KSE-100 Sees Major Drop Post-SBP Rate Hike

Big Tech’s AI Spending Test: Can Revenue Catch Up With Capital Expenditure?

AI Infrastructure Investment Strategies for 2026

Pakistan Freelancers Tax 2026: Payments, Documentation and Formal Growth

Strait of Hormuz Crisis: What the Latest Tanker Attacks Mean for Oil, Shipping and Global Trade

AI Customer Service in 2026: What’s Working, What’s Failing, and What to Buy

Open a Savings Account Online: How to Actually Earn 10x the National Average Rate

Global Housing Market 2026: Where Prices Rise, Where They Don’t

PSX and KSE-100 Record Highs: An Insider’s Guide to Pakistan Stocks

So Delicious Dessert Recall: Affected Products, FDA Guidelines, and Consumer Action

Pakistan’s Current Account Deficit Narrows Sharply to $98 Million in August 2026

Japan Eyes 3.5% Defense Spending: What It Means for Bonds, Stocks, and the BOJ

Top 15 Stocks for Investment in 2026 in PSX: Your Complete Guide to Pakistan’s Best Investment Opportunities
Top 15 Stocks for Investment in 2026 in PSX: Your Complete Guide to Pakistan’s Best Investment Opportunities

Debunking IMF Program Myths: Reconfiguring Engagement for True National Ownership in a Volatile World

Top 10 Mutual Fund Managers in Pakistan for Investment in 2026: A Comprehensive Guide for Optimal Returns

China’s 50% Domestic Equipment Rule: The Semiconductor Mandate Reshaping Global Tech

What the U.S. Attack on Venezuela Could Mean for Oil and Canadian Crude Exports: The Economic Impact

15 Most Lucrative Sectors for Investment in Pakistan: A 2025 Data-Driven Analysis

Pakistan’s Export Goldmine: 10 Game-Changing Markets Where Pakistani Businesses Are Winning Big in 2025

How to Become an Active Taxpayer on Pakistan’s FBR Active Taxpayer List (ATL) in 2026: A Step-by-Step Guide

Pakistan’s Stock Market Renaissance: How 2025’s Hottest Investment Opportunity Is Democratizing Wealth—A Complete Beginner’s Guide

Best Investments in Pakistan 2026: Top 10 Low-Price Shares and Long-Term Picks for the PSX
15 Most Lucrative Sectors for Investment in Pakistan: A 2025 Data-Driven Analysis
15 Most Lucrative Sectors for Investment in Pakistan: A 2025 Data-Driven Analysis

Pakistan’s Economic Outlook 2025: Between Stabilization and the Shadow of Stagnation
-
 Markets & Finance10 months ago
Top 15 Stocks for Investment in 2026 in PSX: Your Complete Guide to Pakistan’s Best Investment Opportunities
-
Markets & Finance10 months ago
Top 15 Stocks for Investment in 2026 in PSX: Your Complete Guide to Pakistan’s Best Investment Opportunities
-
 Analysis9 months ago
Debunking IMF Program Myths: Reconfiguring Engagement for True National Ownership in a Volatile World
-
 Investment10 months ago
Top 10 Mutual Fund Managers in Pakistan for Investment in 2026: A Comprehensive Guide for Optimal Returns
-
 Asia10 months ago
China’s 50% Domestic Equipment Rule: The Semiconductor Mandate Reshaping Global Tech
-
 Global Economy10 months ago
What the U.S. Attack on Venezuela Could Mean for Oil and Canadian Crude Exports: The Economic Impact
-
 AI11 months ago
15 Most Lucrative Sectors for Investment in Pakistan: A 2025 Data-Driven Analysis
-
 Exports11 months ago
Pakistan’s Export Goldmine: 10 Game-Changing Markets Where Pakistani Businesses Are Winning Big in 2025